Categories down, series across, and nothing else to configure
The whole data model is one small table. Rows are categories, the labels that run along the bottom of a bar or line chart or name the slices of a pie. Columns are series, the things being measured. A chart of monthly revenue for two products has twelve categories and two series; a breakdown of a budget has one series and as many categories as there are line items.
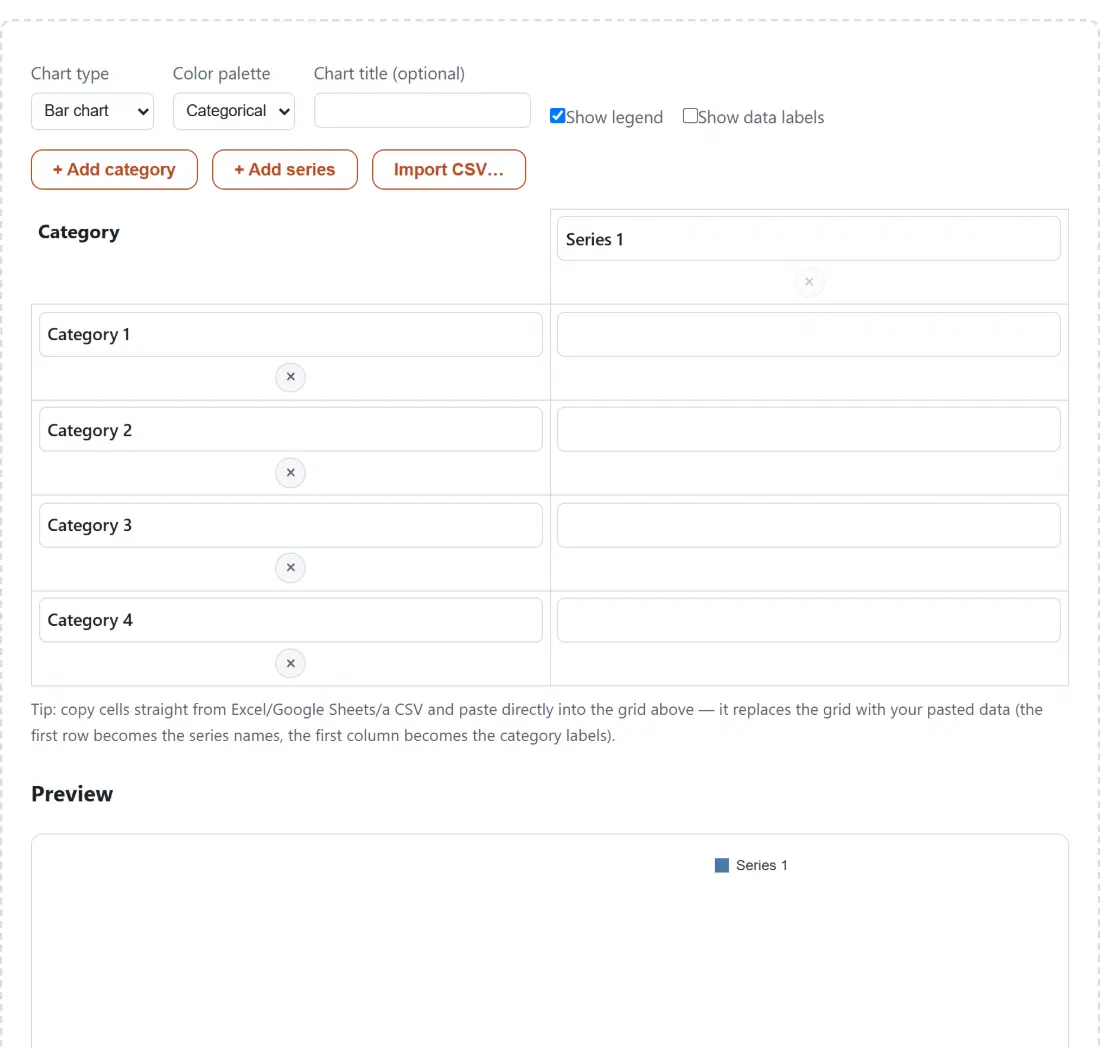
The grid opens with four categories and a single series, all cells empty, and every label in it is editable text rather than a fixed heading. Change “Series 1” to “Revenue” and, on a bar or line chart, the legend updates as you type. The preview underneath redraws on every keystroke, so there is no generate step to click and no state where the picture and the numbers disagree.
Two buttons grow the table, + Add category and + Add series, and a small remove control sits on each row and column. Neither will let you delete the last remaining row or the last remaining column, since a table with nothing in it has no chart to draw.
Getting real numbers into the grid
- Copy a block of cells from a spreadsheet and paste it straight onto the grid. It replaces everything, reading series names from the first row and category labels from the first column. The corner cell of that header row is ignored, so a spreadsheet with a “Month” or “Region” header works without editing.
- Or click Import CSV… and choose a .csv file, which follows exactly the same first-row, first-column convention.
- Or type into the cells directly, which is usually fastest for the handful of numbers a chart of this kind actually needs.
- Pick a Chart type and a Color palette, add a title if you want one, and set the two checkboxes.
Copying a spreadsheet selection is the path most people should use. It takes about two seconds and removes the transcription errors that make hand-typed charts quietly wrong. If the CSV you are starting from is unfamiliar and you want to sort or search it before charting anything, the CSV Viewer opens .csv and .tsv files as a browsable table first.
Four chart types reading the same table
Bar charts group one cluster of bars per category and color them by series, and they always include zero in the scale, so the comparison a bar length invites you to make is the true one. Line charts draw one polyline per series with a marker at each point, and they auto-scale to the data’s own range with a small margin, which is appropriate when the shape of a trend matters more than its distance from zero. Pie and donut charts are the same drawing with and without a hole in the middle, both showing a single series as shares of its total, with the donut’s hole set at just over half the radius.
Legends follow the same logic: bar and line charts legend the series, pie and donut charts legend the categories, because that is what the colors are distinguishing in each case. All three palettes, Categorical, Pastel and Vivid, hold ten colors and hand them out in the same index order, so switching between them recolors the chart without reshuffling which item is which.
No y-axis, which is what the data labels are for
This is the honest limitation to plan around. The chart draws category labels along the bottom and, on a bar chart, a zero baseline. It does not draw a value axis, tick marks or gridlines. That keeps the output clean and small, and it is fine for a chart whose point is a comparison, but it means a reader cannot look up a specific value from the picture alone.
The fix is the Show data labels checkbox, which starts switched off. Turn it on and every bar and line point prints its own number, rounded to two decimal places, while pie and donut slices print their share as a percentage to one decimal. For anything going into a report or a slide where someone might quote a figure, turn it on.
SVG to keep, PNG to paste
Three export buttons sit under the preview. Download SVG saves the exact vector markup you are looking at, which stays sharp at any size and can be reopened and edited in a vector program. Download PNG rasterizes that same markup into a flat image at the chart’s own dimensions, which is the one to use for a slide deck, a document or a chat message. Copy SVG code puts the markup on your clipboard for pasting into a page or a template.
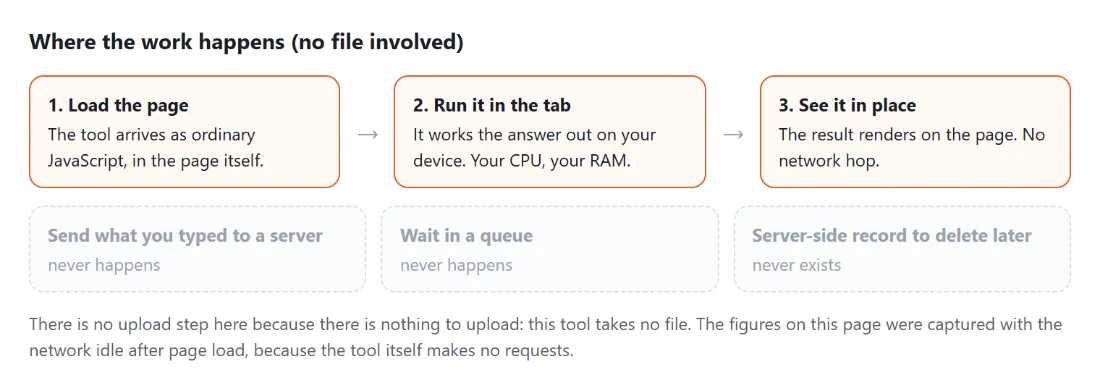
All three come from one source, so the preview, the SVG and the PNG can never disagree. The drawing itself is plain geometry assembled into SVG text in the page, with no charting library and no server involved, which is why data you are not ready to publish is safe to chart here. For a different shape of visual, the Word Cloud Generator sizes words by frequency instead of plotting numbers, and the rest of the generators cover the other make-something-from-scratch tools.