A picture of what a text is about
A word cloud is a frequency chart that does not look like a chart. Size encodes count, and because size is something people read instantly without being taught, a cloud communicates the shape of a text faster than a table of numbers ever will.
That makes it genuinely useful for a specific set of jobs. Skimming a long document to see what it dwells on. Summarising a pile of open ended survey responses. Producing a visual for a presentation about a body of text. Checking whether an article you have written actually emphasises what you intended.
It is not a precise instrument, and that is fine. If you need exact counts, a table is better. A cloud is for the impression.
Building a cloud
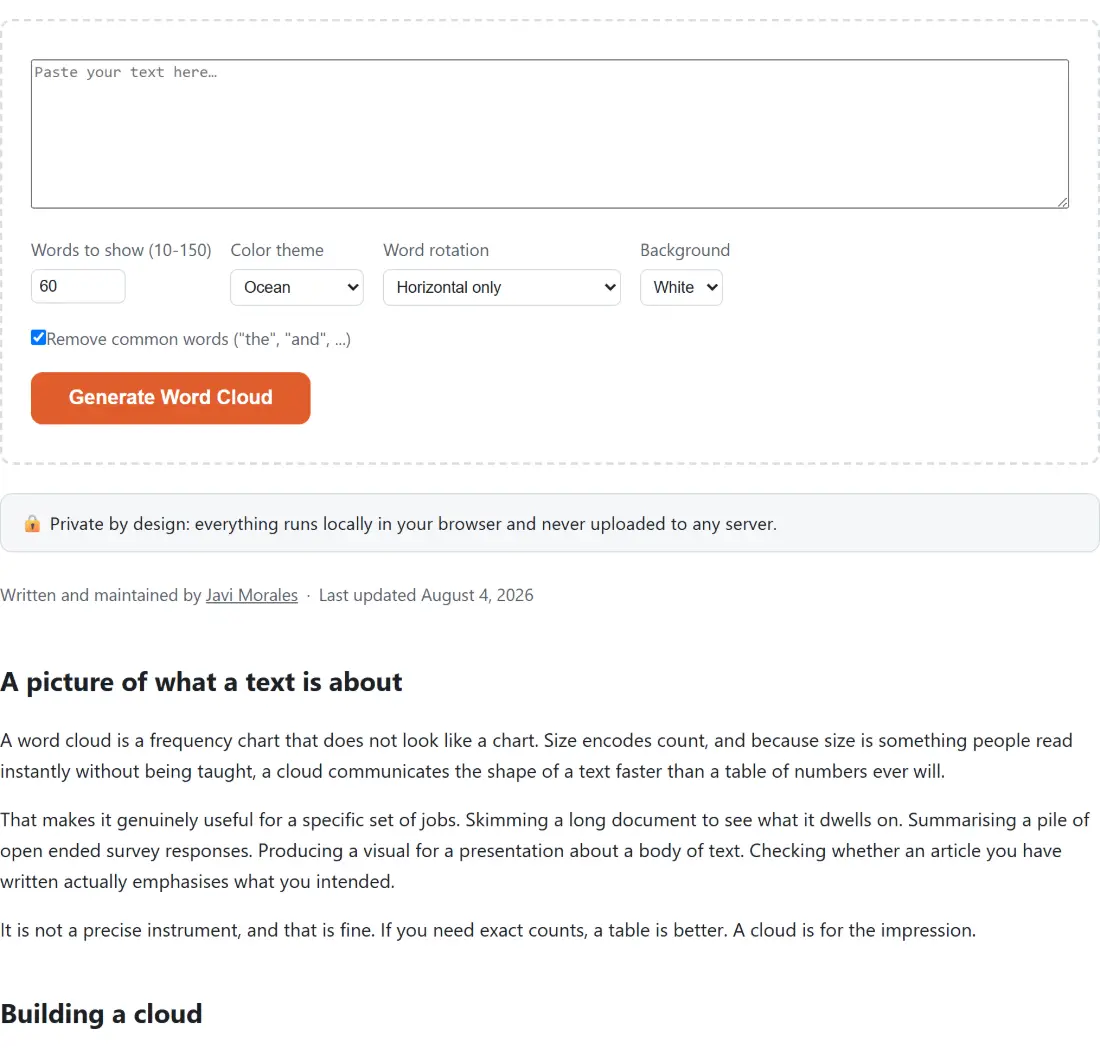
- Paste your text into the box.
- Set Words to show between 10 and 150.
- Choose a Color theme and a Background.
- Choose whether to allow rotated words.
- Leave the common words filter on unless you have a reason to turn it off.
- Generate, then download as PNG or SVG, or copy the SVG source.
The stop word filter earns its default
Turn it off once and the reason it is on becomes obvious immediately.
The most frequent words in any English text are the structural ones: the, of, and, to, a, in. They appear so much more often than anything with meaning that they dominate the size scale completely, and every cloud of every text ends up looking almost identical.
Filtering them out lets the words that actually distinguish your text take the sizes they deserve. The checkbox exists because there are cases where the structural words are the subject, such as comparing writing styles, but for the normal purpose of asking what is this about, leaving it on is correct.
Placement is a spiral, and it is deterministic
Words are placed one at a time, largest first. Each one starts at the centre and moves outward along a spiral, testing positions until it finds one where it does not overlap anything already placed.
Being greedy and largest first has a visible consequence. The biggest words claim the middle, and later words settle wherever there is room, which is what gives a cloud its characteristic shape. It also means a long word can end up further out than a shorter word of the same frequency, simply because it needs a wider gap.
Nothing about the layout is random. The same text with the same settings produces the same picture every time, which matters if you are regenerating a graphic for a document and do not want it to shuffle. Even the rotation follows a rule rather than chance: in mixed mode every third word placed is turned sideways, and the rest stay horizontal so readability is preserved for the majority.
A word that cannot find a free position within the search limit is dropped rather than being overlapped onto something else.
Two export formats for two purposes
SVG is vector. It stays crisp at any size, its words remain real text rather than pixels, and it can be opened and edited in design software. Choose it for anything that will be printed, scaled up, or adjusted later. The source can also be copied directly if you want to paste it into a web page or tweak a colour by hand.
PNG is a plain raster image that works absolutely everywhere with no interpretation. Choose it for a slide, a document, a chat message or anything where the recipient just needs a picture.
Related text and visual tools
For the actual numbers behind the picture, Keyword Density Checker gives frequency and density figures, using the same tokenisation this tool builds on, so the two agree about what counts as a word. Word Counter covers totals and reading time.
For conventional charts rather than a cloud, Chart Maker produces them with the same kind of SVG and PNG export. If you want to pick your own colours rather than use one of the five themes, Color Palette Generator is a good place to start. The rest are on the generators hub.