Two regressions, two climates, and the gap between them
There is no single equation for what the weather feels like. The US National Weather Service publishes two, each fitted to a different kind of day, and this page implements both without blending them.
The heat index is the Rothfusz regression, which estimates how much hotter humid air feels once sweat stops evaporating efficiently. It is only applied at 80 F (26.7 C) or above with relative humidity of 40% or more. Wind chill is the 2001 revision agreed between the NWS and Environment Canada, and it only applies at 50 F (10 C) or below with wind of at least 3 mph.
Those two domains cannot overlap, which is the quiet reason a single feels-like number is well-defined here. Between them sits a wide band where neither idea means anything. Ask for 65 F at 50% humidity with a 12 mph breeze and the report says plainly that no formula applies, then repeats 65.0 F as the answer. That is more useful than a spuriously precise number produced by running a regression outside the data it was fitted to.
The metric half and the imperial half of the same form
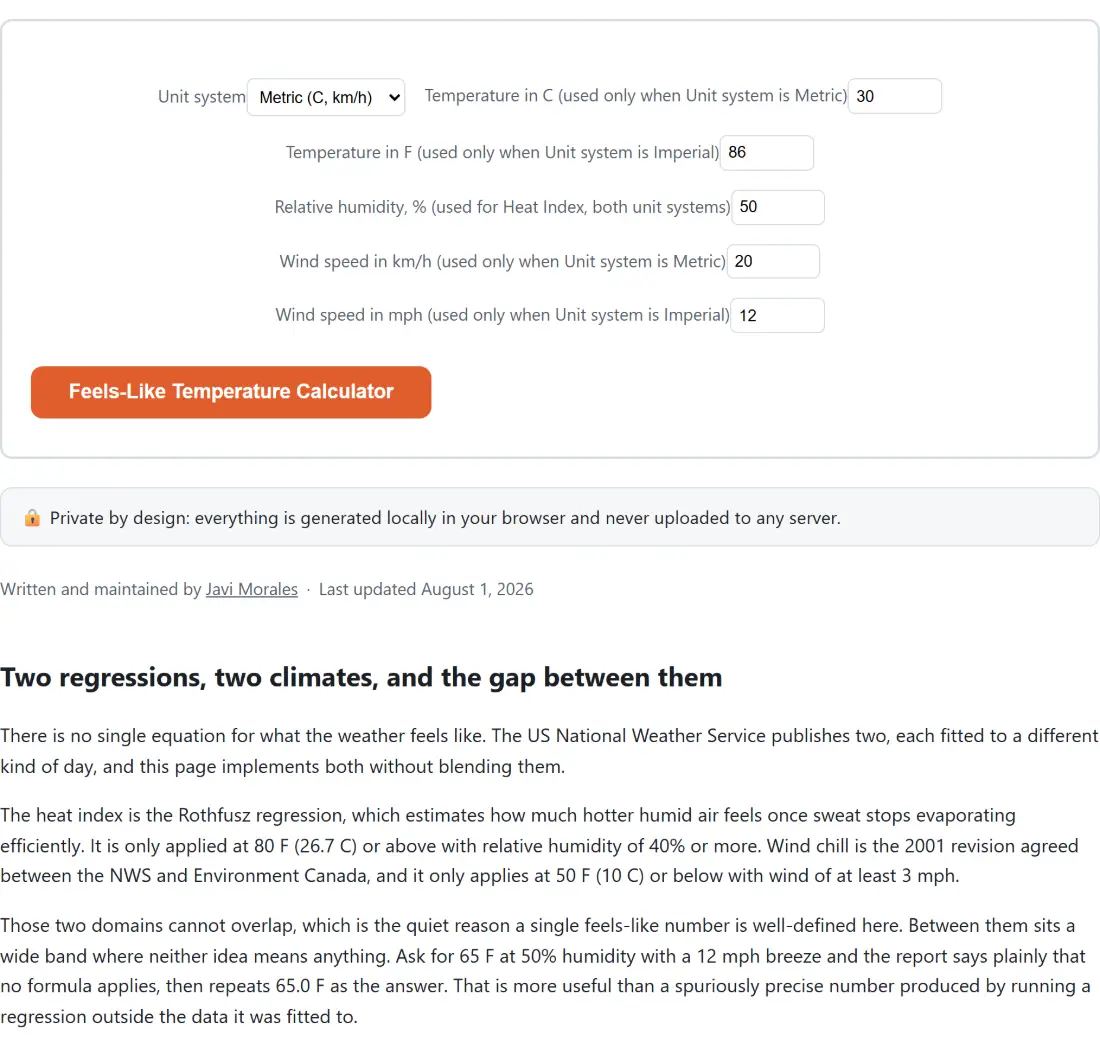
Five numeric fields are always on screen, but only three of them are ever read. The unit system selector decides which three, and each field’s own label says which system it belongs to.
- Set Unit system to
Metric (C, km/h)orImperial (F, mph). - On the metric side, fill
Temperature in C (used only when Unit system is Metric)andWind speed in km/h (used only when Unit system is Metric). On the imperial side, fillTemperature in F (used only when Unit system is Imperial)andWind speed in mph (used only when Unit system is Imperial)instead. - Fill
Relative humidity, % (used for Heat Index, both unit systems), which has no unit variant and is read whichever system you chose. - Press the action button, which carries the tool’s own name, Feels-Like Temperature Calculator.
Leftover numbers in the other system’s fields are harmless. They are never referenced, so there is no route to a mixed-unit answer such as a Celsius reading paired with a wind speed in mph. If you need to move a reading between the two systems before you start, the Unit Converter covers both, with Temperature and Speed among its categories.
What each labelled block of the report actually says
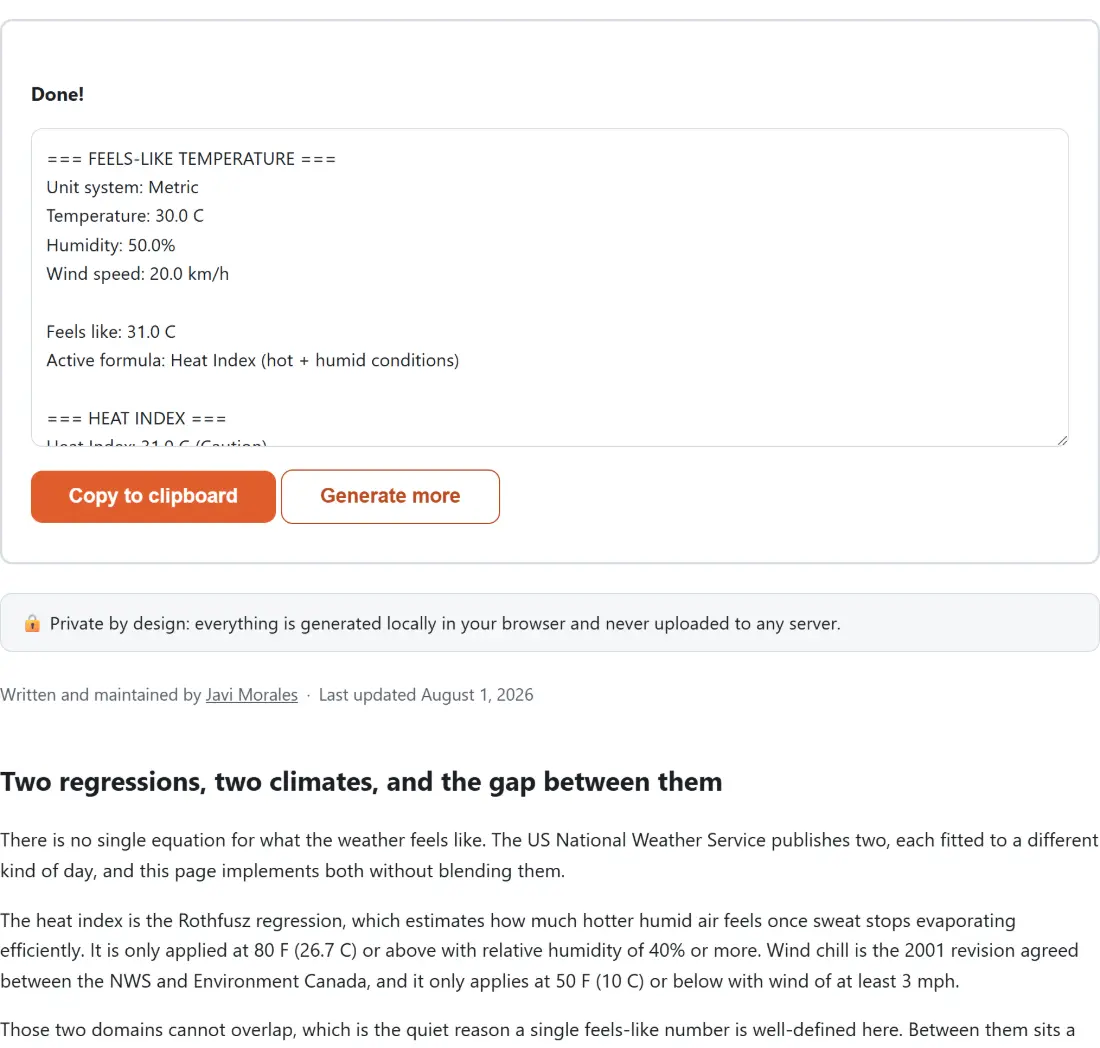
The output is plain text in four labelled blocks. The first echoes your inputs and gives the
headline Feels like figure plus a line naming which formula produced it. The next two blocks
report the heat index and the wind chill separately, each either as a value with a risk category
or as an explicit “not applicable” line quoting the threshold it missed. The last block is a
short safety notice: these are planning figures, not a replacement for a local warning or for
medical advice.
Nothing here calls a weather service. The arithmetic is a few dozen lines of JavaScript running in the page, so there are no coordinates to hand over and no forecast to fetch, which also means the page keeps working with the network off.
At the bottom edge of the heat index, the formula dips below the thermometer
Feed it 80 F and 40% humidity, the lowest pair the heat index domain admits, and the regression returns 79.9 F. The apparent temperature comes out a tenth of a degree colder than the air. That is not a transcription slip. Regression curves are fitted, and this one is slightly low at its own corner, which is exactly why the NWS restricts it to a domain rather than letting it run everywhere.
Move into the middle of the range and it behaves as you would expect. The metric defaults, 30 C with 50% humidity, produce a feels-like reading of 31.0 C in the Caution band. Push to 35 C at 70% humidity and it reaches 50.3 C, which the report tags as Danger. In imperial terms, 90 F with 70% humidity comes out at 105.9 F, the reference point recorded in the module’s own source notes as the value it was checked against before shipping.
Risk bands are graded in Fahrenheit even when the reading is Celsius
This is the one thing worth knowing before you trust a category label in metric mode. Both classifiers take the Fahrenheit value; the conversion to Celsius happens afterwards, purely for display. So an air temperature of -5 C with 60% humidity and 30 km/h of wind reports a wind chill of -13.0 C and calls it Low risk, because -13.0 C is 8.6 F and the mildest wind chill band starts at 0 F.
The bands are also tested on the unrounded value while the display rounds to one decimal, so the two can disagree at a boundary. An air temperature of -4 F with an 8 mph wind computes to -18.99 F, prints as -19.0 F, and is labelled Moderate risk, because -18.99 is on the warm side of the -19 F edge. Take 0 F with a 15 mph wind instead and you get -19.4 F, which lands in High risk.
Wind chill categories here are deliberately coarse. A frostbite chart is a genuine function of temperature and wind speed independently, so two different combinations can produce the same chill value with different real exposure times. Inventing a minutes-to-frostbite figure from one derived number would be false precision, and the tool does not do it.
Where the 4.8 km/h wind threshold is a rounding, not a rule
The “not applicable” line for wind chill quotes the threshold as 3 mph or 4.8 km/h. The gate itself is the mph one. Because a mile is exactly 1.609344 km, 3 mph is 4.828 km/h, and the printed 4.8 is that number rounded down. Type 4.8 km/h on a cold day and the wind chill block still reports itself inactive; type 4.83 and it switches on. It is a gap of roughly three hundredths of a km/h that only shows up if you deliberately sit on the boundary, but it is worth knowing before you conclude the tool is broken.
Everything else is clamped rather than rejected. Values beyond a field’s stated minimum or maximum are pulled back to the limit before any arithmetic runs, which keeps the report free of the NaN readings that ruin a lot of quick browser calculators. The one input state that catches people out is an emptied box, which arrives as 0 rather than as the value the field started with. If you are stacking this against other planning numbers, the calculators hub has the rest of the set, the Golden Hour Calculator tells you when the light will be worth the cold, and the BMI Calculator uses the same metric-or-imperial field pattern if the layout here looks familiar.