A table you can interrogate, not just look at
A printed periodic table answers one question well: where does this element sit. Everything else, from what phase it is at room temperature to who first isolated it, means going elsewhere.
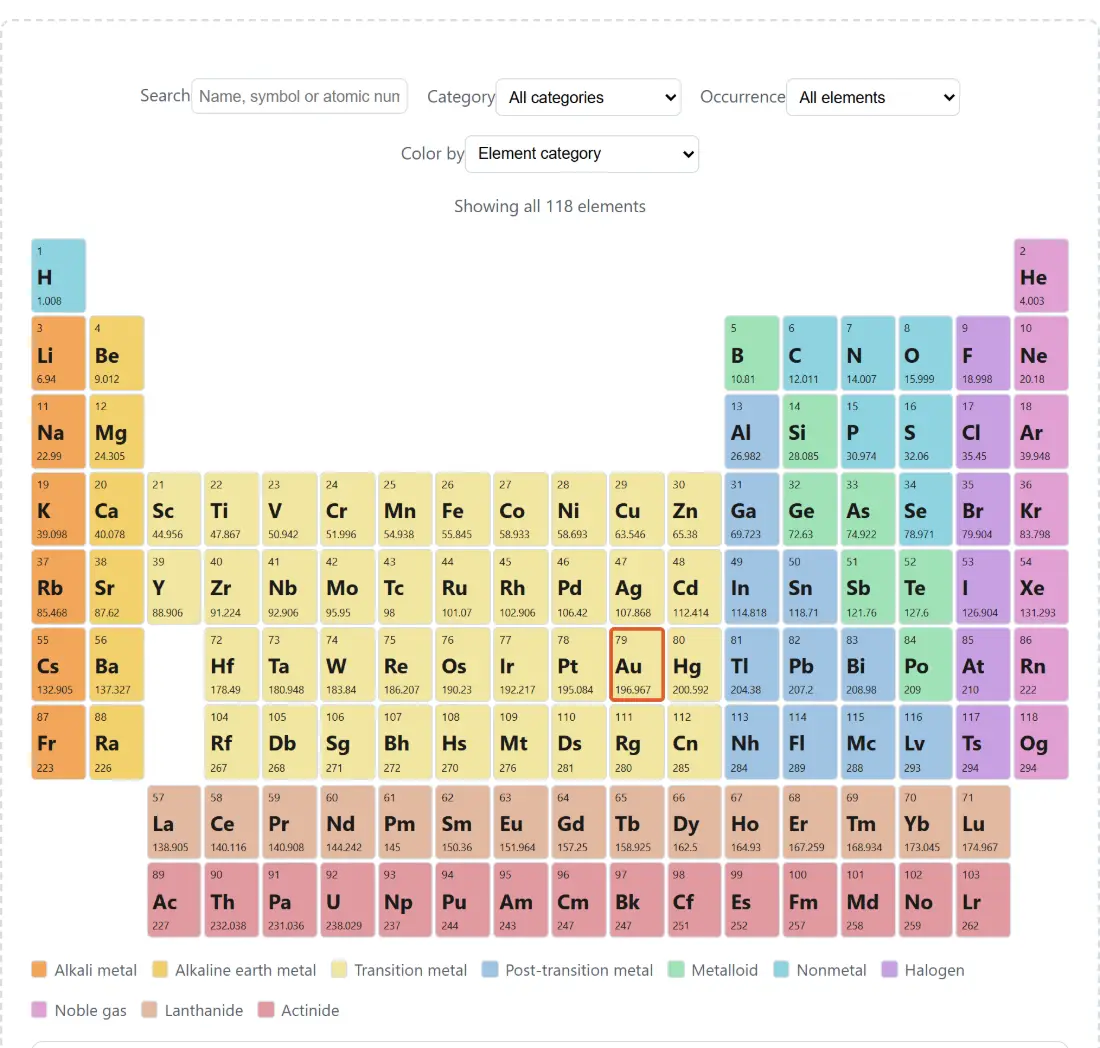
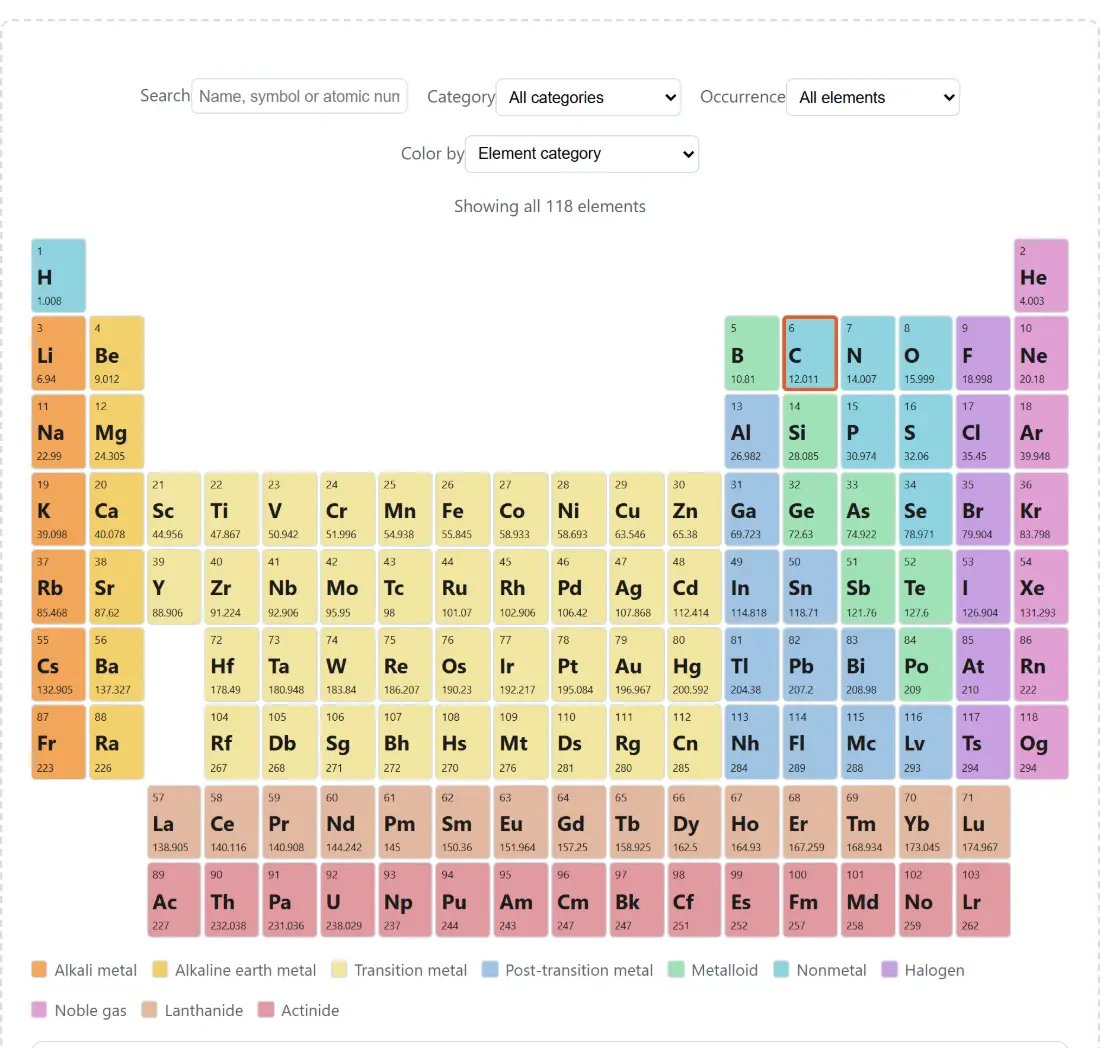
This one carries the whole dataset. Every element has its standard atomic weight, its category, its period and group, its ground-state electron configuration in noble gas shorthand, its phase at room temperature, who discovered it and when, a one-line note on what it is actually used for, and whether it occurs naturally. Clicking a cell opens all of that in a panel beside the grid.
The dataset is built into the page. Nothing is fetched while you use it, so it works on a school network that blocks half the internet, and it works offline once the page has loaded.
Finding an element and filtering the grid
- Type into Search. The placeholder says Name, symbol or atomic number, and all three work, so tungsten, W and 74 all land on the same cell.
- Narrow by Category using the dropdown, which starts on All categories and offers each of the ten families.
- Narrow by Occurrence with All elements, Naturally occurring or Synthetic only.
- Watch the count line. With no filters it reads that it is showing all 118 elements; with any filter applied it tells you how many of the 118 match.
- Change Color by between Element category, Natural vs. synthetic and Phase at room temperature. The legend under the grid changes with it.
- Click any cell to open its detail panel, which lists Atomic mass, Electron configuration, Period / Group, Phase at room temperature, Naturally occurring, Discovered by and Notable use.
- Click Download printable PDF to save a wall chart of the grid in whichever colour mode is currently active.
Switching to the phase mode is the demonstration I would show a class first. Two cells come out as liquids, bromine and mercury, and seeing that against 116 that are not makes the point far faster than saying it.
The natural versus synthetic line, and where it gets blurry
Ninety elements are marked naturally occurring and 28 synthetic, and the rule behind that split is worth stating because it is more interesting than a cutoff.
Everything up to uranium is natural, including the elements that only exist as fleeting products of radioactive decay chains. Polonium, astatine, radon, francium, radium and actinium are all genuinely present on Earth, continuously produced as uranium and thorium break down, even though individual atoms survive for minutes or days. Two elements below uranium break the pattern: technetium and promethium have no isotope stable enough to have survived from the Earth’s formation, and no natural pathway makes them in detectable quantities here.
Above uranium, everything is officially synthetic. The honest footnote is that neptunium and plutonium have since been confirmed in trace natural amounts, made inside uranium ores by neutron capture. Their official classification has not changed, because classification records where an element was first obtained, and the flag on their cards reflects that official position rather than the trace-amounts nuance.
That flag is derived from one rule applied to the atomic number rather than typed in element by element. That matters more than it sounds: an earlier version of this dataset had polonium and astatine marked synthetic while radon and radium next door were marked natural, which is chemically incoherent and exactly what happens when a hundred and eighteen booleans are entered by hand.
Reading the layout
Ten categories, from alkali metals through alkaline earth metals, transition and post-transition metals, metalloids, nonmetals, halogens and noble gases, to the lanthanides and actinides.
The last two live in their own rows at the bottom, separated from the main table by a deliberate blank gap. This is the conventional presentation and it is a compromise: those fourteen-element series really do belong inside rows six and seven, but including them there would make the chart fourteen columns wider. The gap is the visual signal that they were lifted out rather than appended.
Twenty-seven elements carry no single conventional group number for the same reason, so their detail panel shows a period without a group rather than inventing one.
Study tools that pair with it
Looking things up is not the same as learning them. Flashcard Maker is the obvious next step for symbols and atomic numbers, since the recall direction that matters in an exam is usually the one a printed table makes easy.
For the arithmetic side of a chemistry course, Scientific Calculator handles the exponents and logarithms that molarity and pH work demands. Times Tables Practice is aimed at younger students, and GPA Calculator is for what happens after the exam. The rest is on the calculators hub.