Design software shows you the colors you picked. This page shows you the colors a meaningful share of your audience actually receives, side by side with the originals, for a pasted list of brand codes and for a screenshot or photo at the same time.
The four simulated views, and the original beside them
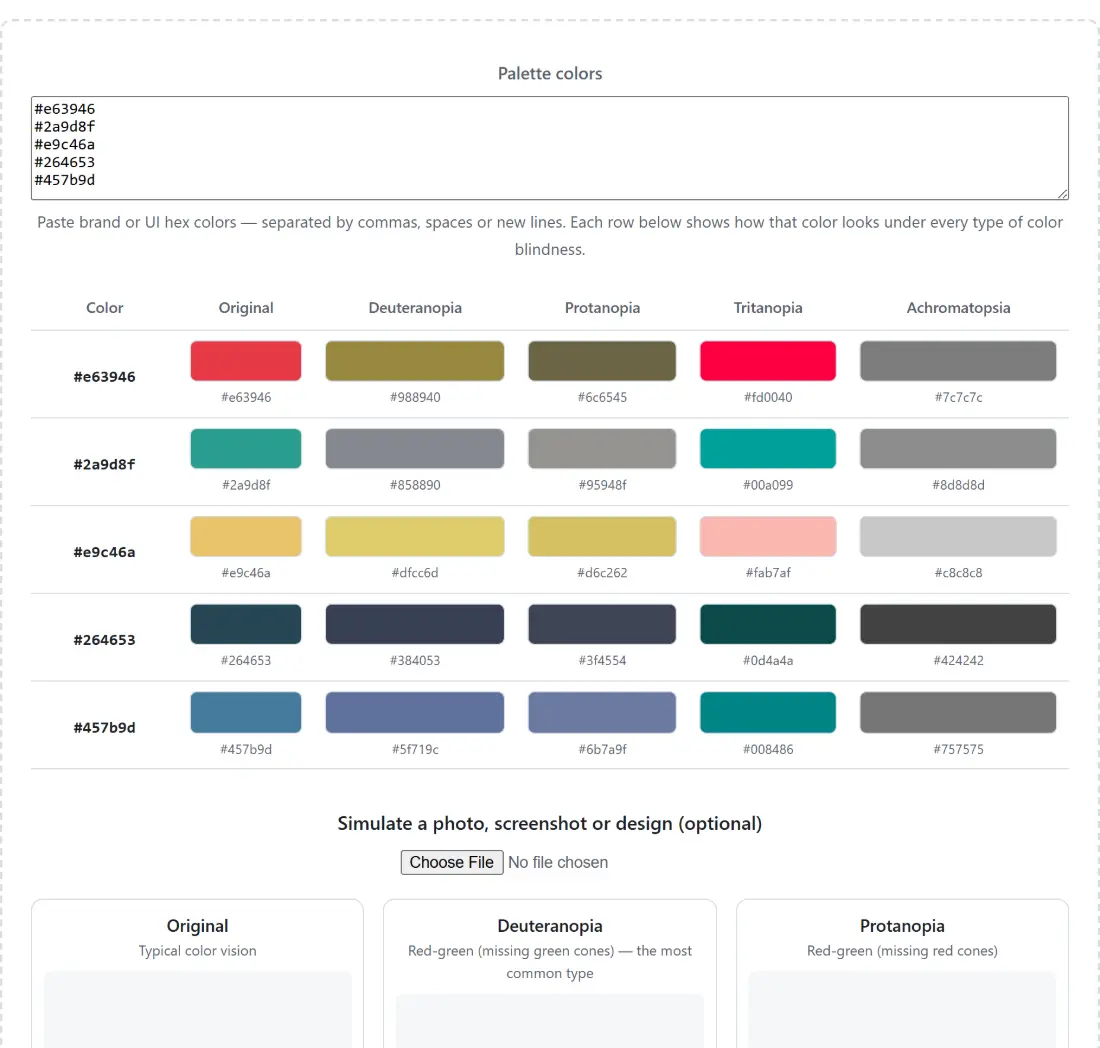
The table starts with a Color column echoing the hex code you typed, then Original, then four simulated views. Deuteranopia and Protanopia are the two red-green dichromacies, missing green and red cones respectively, and they are the ones almost every real-world failure comes down to. Tritanopia is the blue-yellow dichromacy and is rare. Achromatopsia is total color blindness, where only brightness survives.
Each of those five headings carries a hover note, one line describing what you are looking at, so you can identify a column without leaving the table.
Pasting a palette, then dropping in a screenshot
- Replace the contents of the Palette colors box with your own codes. The leading hash is optional, three-digit shorthand is expanded, and commas, spaces, semicolons and line breaks are all treated as separators.
- Read the table row by row. Every cell renders the simulated swatch and prints its resulting hex code underneath, so you can compare output values numerically instead of squinting at two squares.
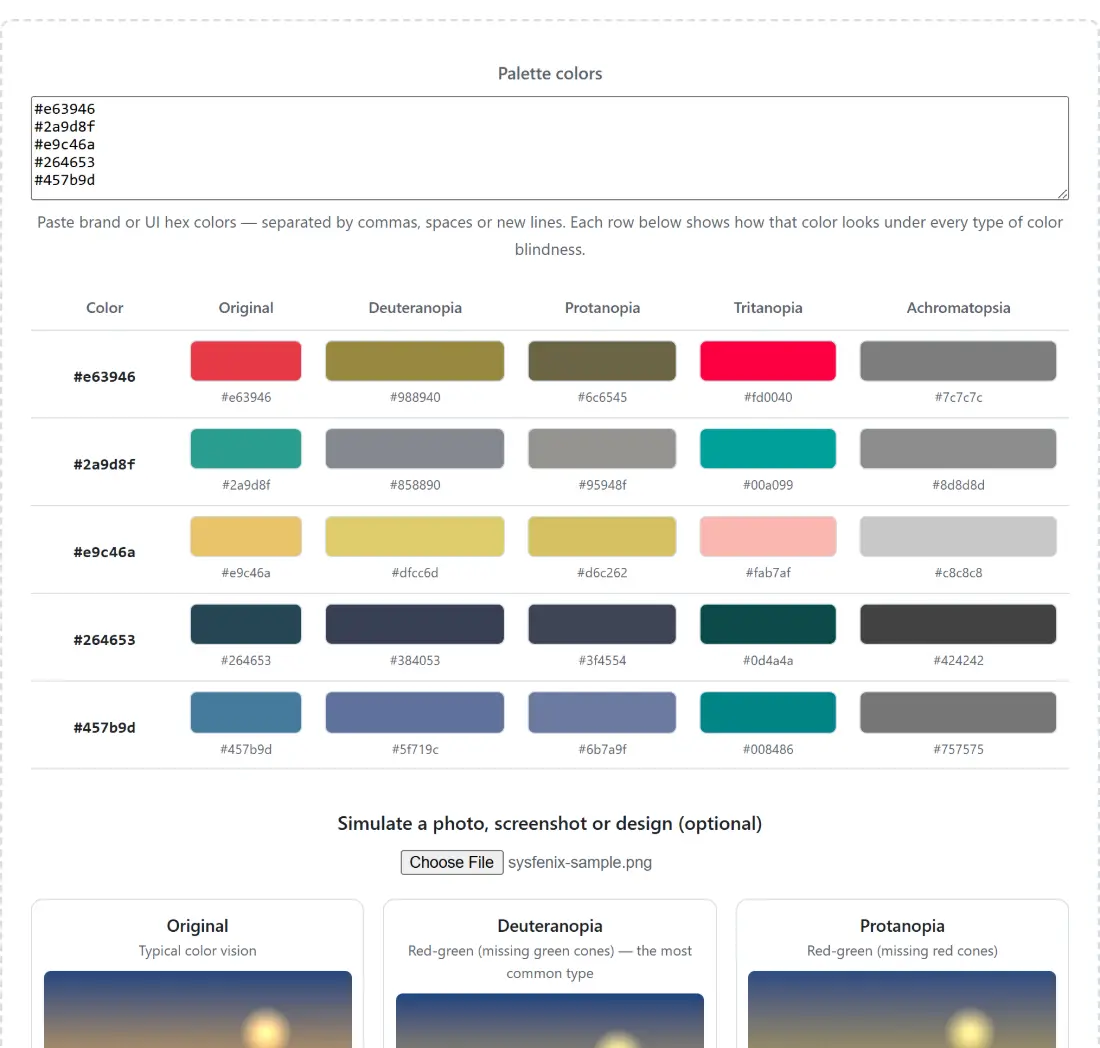
- Load a chart, map, dashboard or photo through the Simulate a photo, screenshot or design (optional) file field. Five captioned canvases appear below, one per column.
- Press Choose another image to clear the current preview, then pick a new file from the same field. The palette table and the image preview are independent, so both can sit on screen together.
Unreadable tokens are skipped rather than rejected. Paste a line containing a
stray label or a CSS keyword such as rebeccapurple and only the parseable hex
codes survive into the table.
The linear-light step that separates this from a CSS filter
The three dichromacy columns use the Machado, Oliveira and Fernandes (2009) severity-1.0 matrices, reproduced verbatim from the published tables. The matrix itself is the easy part. Where quick simulators usually go wrong is what they multiply: sRGB bytes are gamma encoded, and these coefficients are defined on linear light. Here every channel is decoded with the exact sRGB transfer curve first, multiplied, clamped into range, and only then re-encoded back to a byte. Skipping the decode produces results that look plausible and are wrong, especially through the mid-tones where the gamma curve bends hardest.
For the image path the decode is folded into a 256-entry lookup table before the pixel loop begins, since a byte only has 256 possible values, and the alpha byte of every pixel is copied straight through.
Achromatopsia is a luminance grayscale, not a channel average
The last column is not a Machado matrix. It computes Rec.709 relative luminance, 0.2126 R plus 0.7152 G plus 0.0722 B, on linear light, then writes that single value into all three output channels. The naive average of the three channels is deliberately avoided, because it scores a saturated blue and a saturated green as equally bright when they are nowhere close.
Treat that column as the worst case worth designing against. If a status badge or a chart series still reads with hue removed altogether, it reads for everybody. Because each cell prints its hex code as well as its swatch, you can read the two grays off the page directly, or drop the originals into the color converter to see the same gap expressed as HSL lightness. If the colors you want to test are locked inside a screenshot rather than a style sheet, the image color picker will pull them out as hex codes you can paste back in here.
A red and a green that both land on olive
Two colors a dashboard reaches for by reflex: #d62828 for an error state,
#2a9d20 for success. Feed both into the box and the deuteranopia column
returns #8c7d1f and #94852f. Two olives, eight levels apart in both the red
and the green channel. Nothing about the hue distinction that carried the
meaning survives.
The same pattern shows up in a palette that looks nothing alike. The default
list on the page opens with #e63946 and #2a9d8f, a red and a teal. Under
achromatopsia they resolve to #7c7c7c and #8d8d8d, seventeen levels apart on
the 0 to 255 scale. That is why the answer is almost never “pick different
colors” but “stop carrying the meaning in hue alone”: add an icon, a label, a
pattern, or spread the pair further apart in lightness.
Where full dichromacy stops being the whole story
Only severity 1.0 is modeled. Anomalous trichromacy, where a cone is shifted in sensitivity rather than missing, is more common than full dichromacy and lands somewhere between these columns and unmodified vision. Take what you see as the strong end of a range rather than as the single outcome, which is the same point the widget makes in the disclaimer it prints beneath itself.
Everything happens in the tab. The picture is decoded with createImageBitmap
into a canvas your browser owns, and there is no request that could carry an
unreleased mockup anywhere. Once the palette survives this page, take the pairs
that also carry text through the WCAG contrast checker,
since distinguishable and legible are separate tests. If a palette collapses
badly here, the color palette generator is a
reasonable place to roll a replacement set, and the rest of the
developer tools hub covers the surrounding formatting and encoding
work.