Weighted categories, and the trap of averaging your scores
Almost every syllabus splits a course into categories with different weights, and almost every panicked mental estimate ignores them. Average 94, 88 and 79 in your head and you get 87. Weight those same three scores at 20%, 15% and 25% and the honest answer is 86.25%. The gap is small here and can be enormous when the heavy category is the one that went badly.
The calculator does two separate jobs with those weights. The first is descriptive: what is my grade right now, counting only the work that has actually been marked. The second is the one people really come for: given what I have banked, what do I need on everything that is left.
Setting up your syllabus in the category table
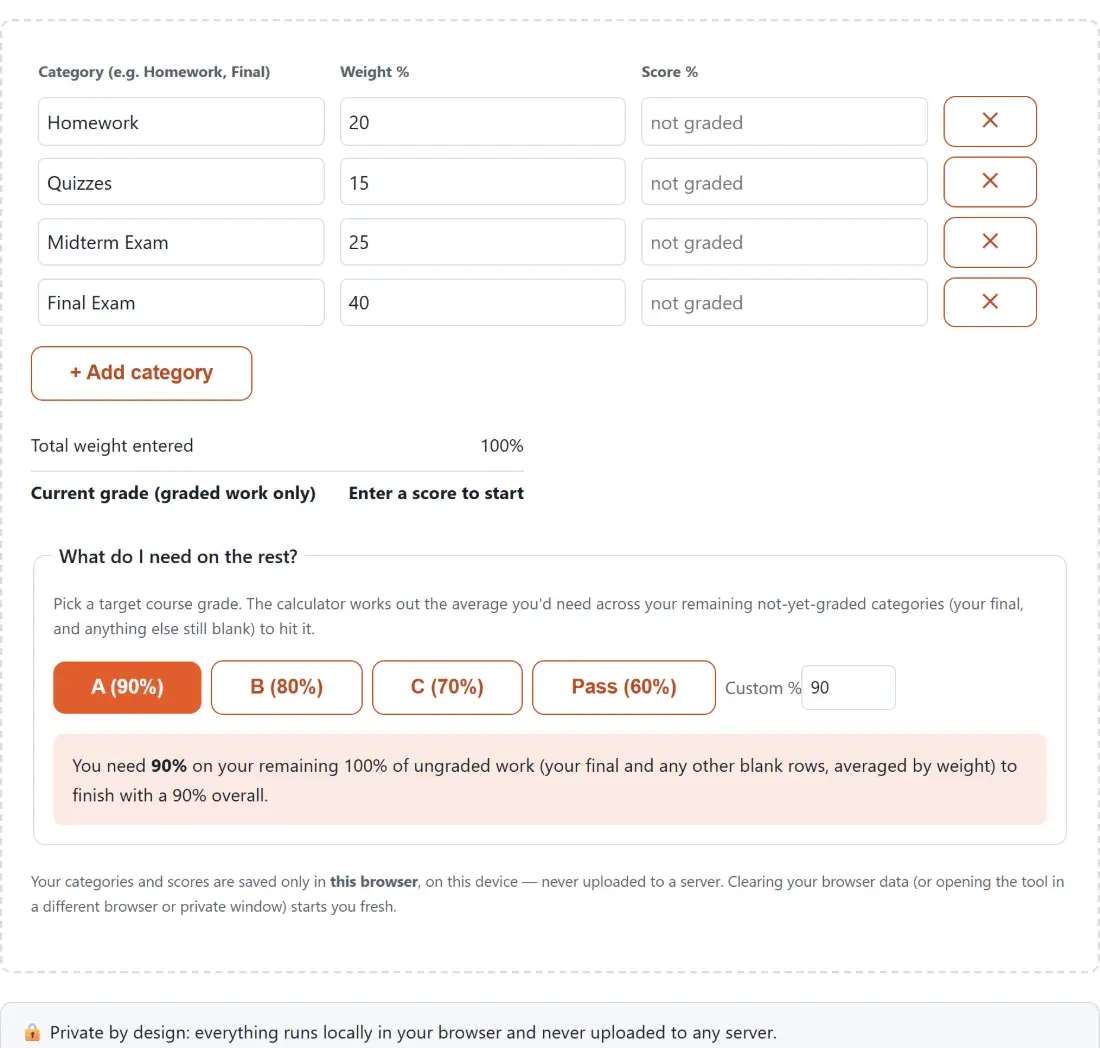
- Name each part of the course in the Category (e.g. Homework, Final) column. The page opens with four rows already filled in, Homework at 20, Quizzes at 15, Midterm Exam at 25 and Final Exam at 40, with every score blank.
- Put each category’s share of the course in Weight %, then your marked result in Score %. Leave Score % empty for anything not yet graded; the placeholder in that cell reads “not graded”.
- Add or drop rows with + Add category and the ✕ button. As with a spreadsheet, the last remaining row cannot be removed.
- Watch Total weight entered and Current grade (graded work only) update as you type. Before any score is entered, the grade cell reads “Enter a score to start”.
- In What do I need on the rest?, click A (90%), B (80%), C (70%) or Pass (60%), or type your own figure into Custom %. The answer names the exact average you need across every blank row.
Working the weighted average backwards to a required final
Take the default four categories and post three of the four grades: Homework 94, Quizzes 88, Midterm Exam 79, Final Exam still blank.
Current grade (graded work only) shows 86.25%, based on the 60% of the course already scored. Now pick a target and the tool rearranges the same equation to solve for the missing score. For an A at 90% you need 95.63% on that final. For a B at 80% you need 70.63%. Drop the target to a C and the figure falls to 45.63%; the Pass button puts it at 20.63%.
Nothing is rounded on the way through. Every figure is computed at full floating point precision and only the final display is trimmed to two decimals, so the 95.63 on screen is the exact 95.625 the algebra produces, rounded once at the end.
Not achievable, already secured, and the honest middle
A grade calculator earns its keep by refusing to quote impossible numbers. Change the midterm in that example from 79 to 62 and the current grade drops to 79.17%. Ask for an A and you get Not achievable, because the arithmetic wants 106.25% from a final that tops out at 100. Ask for a B instead and it is back in reach at 81.25%.
The reverse case is just as useful. Score 96% on coursework worth 80% of a module and ask for a C at 70%, and the tool answers You’ve already secured it, because the required score comes out negative: even a zero on the remaining 20% leaves you above the line. And when no row is left blank at all, it stops solving and tells you plainly that your current grade is your final grade.
That third state matters more than it looks. It is the moment to stop refreshing the calculator and go and do something else.
Blank scores, missing weights and other partial syllabuses
Two design choices keep partial data honest. A blank score is excluded from the current grade rather than counted as zero, so a course you are halfway through never reads as a catastrophe. And the division uses the weights you actually typed rather than assuming 100, so a half-entered syllabus still produces a meaningful percentage.
The catch is that the target solve cannot know what you left out. Enter rows adding to 85 and it treats 85 as the whole course, which is the right answer to the question you asked and the wrong answer to the question you meant. The note beside Total weight entered flags the mismatch as soon as it appears. If you are converting raw points such as 43 out of 50 into the percentage that goes in the Score % box, the Percentage Calculator has a mode for exactly that, and the Scientific Calculator keeps a history of the expressions you typed if you would rather work it out by hand.
The saved draft in local storage, and its limits
Your rows and your chosen target are written back to this browser’s local storage on every edit, so closing the tab mid-semester and coming back in April finds the course exactly as you left it. A malformed or hand-edited row is dropped rather than allowed to break the page, and a stored target that is not above 0 and at most 100 quietly reverts to 90.
Everything about that is local and single-device, which is a fair trade for a tool with no account. If you would rather combine finished letter grades across a whole semester than track one course, that is the GPA Calculator, which weights by credit hours instead. Both sit on the calculators hub alongside the rest, and our guide to the best free online calculators walks through the GPA one and the rest of the everyday maths set.