Two formulas, and the number each one starts from
Every heart rate zone chart is a percentage of something, and the argument is over what that something should be. This calculator offers both of the answers that are actually defensible.
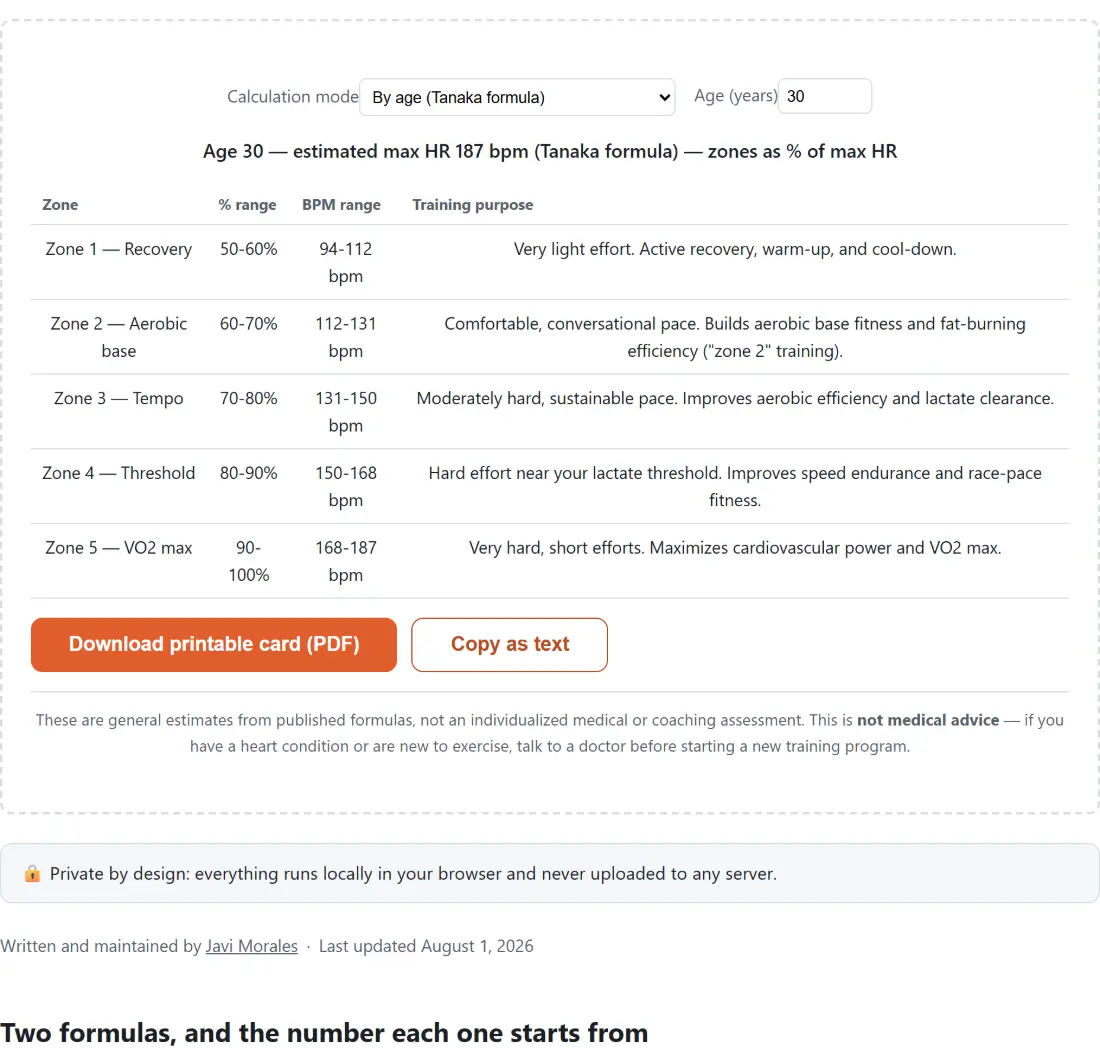
Pick By age (Tanaka formula) and it estimates your maximum heart rate as 208 minus 0.7 times your age, then reads each zone straight off that number as a percentage. Pick By max & resting heart rate (Karvonen) and it wants a max you already have, from a real effort test or a watch, plus your resting rate; the zones are then percentages of your heart rate reserve, the gap between the two, added back on top of the resting figure.
The first mode needs one number you certainly know. The second needs two numbers you might have to go and find, and rewards you with a result shaped by your own physiology rather than by your birthday.
Reading your zones off the table
- Choose your Calculation mode. The page opens on the age method.
- In age mode, set Age (years). In the other mode you get Your max heart rate (measured or estimated, bpm) and Resting heart rate (bpm) instead.
- Read the five rows straight away. There is no calculate step: the table redraws on every keystroke, with a % range, a BPM range and a Training purpose for each zone.
- Press Download printable card (PDF) for a one-page sheet, or Copy as text to paste the same numbers into a training log. The copy button flips to Copied! when it worked.
Tanaka against 220 minus age, at five different ages
The old rule of thumb subtracts your age from 220. The formula used here comes instead from a 2001 meta-analysis by Tanaka, Monahan and Seals covering 351 studies, and it is not simply a lower version of the old rule. The two cross over:
| Age | Tanaka estimate | 220 minus age |
|---|---|---|
| 20 | 194 bpm | 200 bpm |
| 30 | 187 bpm | 190 bpm |
| 40 | 180 bpm | 180 bpm |
| 55 | 170 bpm | 165 bpm |
| 70 | 159 bpm | 150 bpm |
At exactly 40 the two agree. Below that the old rule runs high, and above it the old rule runs increasingly low, by 9 bpm at 70. That last row is the one that matters most in practice, because an older runner following the 220 rule is being told to train harder than the better-supported formula suggests, not easier.
For a 42-year-old the tool estimates 179 bpm and lays out Zone 1 at 89 to 107, Zone 2 at 107 to 125, Zone 3 at 125 to 143, Zone 4 at 143 to 161 and Zone 5 at 161 to 179 bpm.
The gap between percent of max and Karvonen, quantified
The two modes do not agree, and it is worth knowing by how much. Both columns below come straight off the tool. The left one is age mode at 30, where the Tanaka estimate lands on exactly 187 bpm; the right one is the other mode with that same 187 typed in as the max, alongside a resting rate of 60.
| Zone | Percent of max, age 30 | Karvonen, 187 and 60 |
|---|---|---|
| Zone 1 | 94 to 112 bpm | 124 to 136 bpm |
| Zone 2 | 112 to 131 bpm | 136 to 149 bpm |
| Zone 3 | 131 to 150 bpm | 149 to 162 bpm |
| Zone 4 | 150 to 168 bpm | 162 to 174 bpm |
| Zone 5 | 168 to 187 bpm | 174 to 187 bpm |
The Karvonen column sits higher everywhere except at the very top, where both methods necessarily land on your max. The gap is widest at the bottom of Zone 1, a full 30 bpm here, and narrows steadily to nothing at 100%, because the share of your resting rate that gets added back shrinks as the intensity percentage rises. A higher resting rate widens the gap rather than narrowing it, which is the opposite of what most people assume.
Neither column is wrong. They are two conventions for labelling the same effort, and the only real mistake is mixing them, for instance taking a Zone 2 bpm from one and comparing it against a watch configured for the other.
The printable card, and what it puts on the page
The download button builds the PDF in your own browser with pdf-lib, the same library the PDF tools on this site use, and hands you a file called heart-rate-zones.pdf. It is a single A4 page: a heading, a one-line summary of the inputs and method, the zone table with its purpose column wrapped to fit, and the not-medical-advice notice in grey underneath. That notice is deliberately baked into both the PDF and the copied text, because a printed card is exactly the thing that ends up on a gym wall detached from any context.
Once the file is built it saves itself, and a short confirmation with a manual download link appears underneath in case your browser blocked the automatic save. If the PDF cannot be built at all you get a message asking you to try again; the copy button is quieter and simply never flips to its confirmed state when the clipboard is unavailable.
Limits of a formula, and when to ask a doctor
Both formulas are population averages. Real maximum heart rates scatter widely around any age-based estimate, and medication, altitude, heat, caffeine and illness all move the number that matters on the day. Only a supervised maximal test settles your own figure, and even a watch’s recorded peak is only the highest value it happened to see.
This is general information, not a medical or coaching assessment, and the tool says so on screen and on the card. If you have a heart condition, are returning to training after a break, or are unsure what intensity is safe, talk to a doctor before starting a program. Once you do have numbers to work with, the Running Pace Calculator turns a target time and distance into the pace you have to hold, the Interval Timer counts the short Zone 5 efforts for you, and the One Rep Max Calculator covers the strength side. The rest of the set lives on the calculators hub.