Three fields, and the one the calculator fills in
Pace, time and distance are one equation seen from three angles. Divide time by distance and you have pace; multiply pace by distance and you have time; divide time by pace and you have distance. Fix any two and the third is no longer yours to choose.
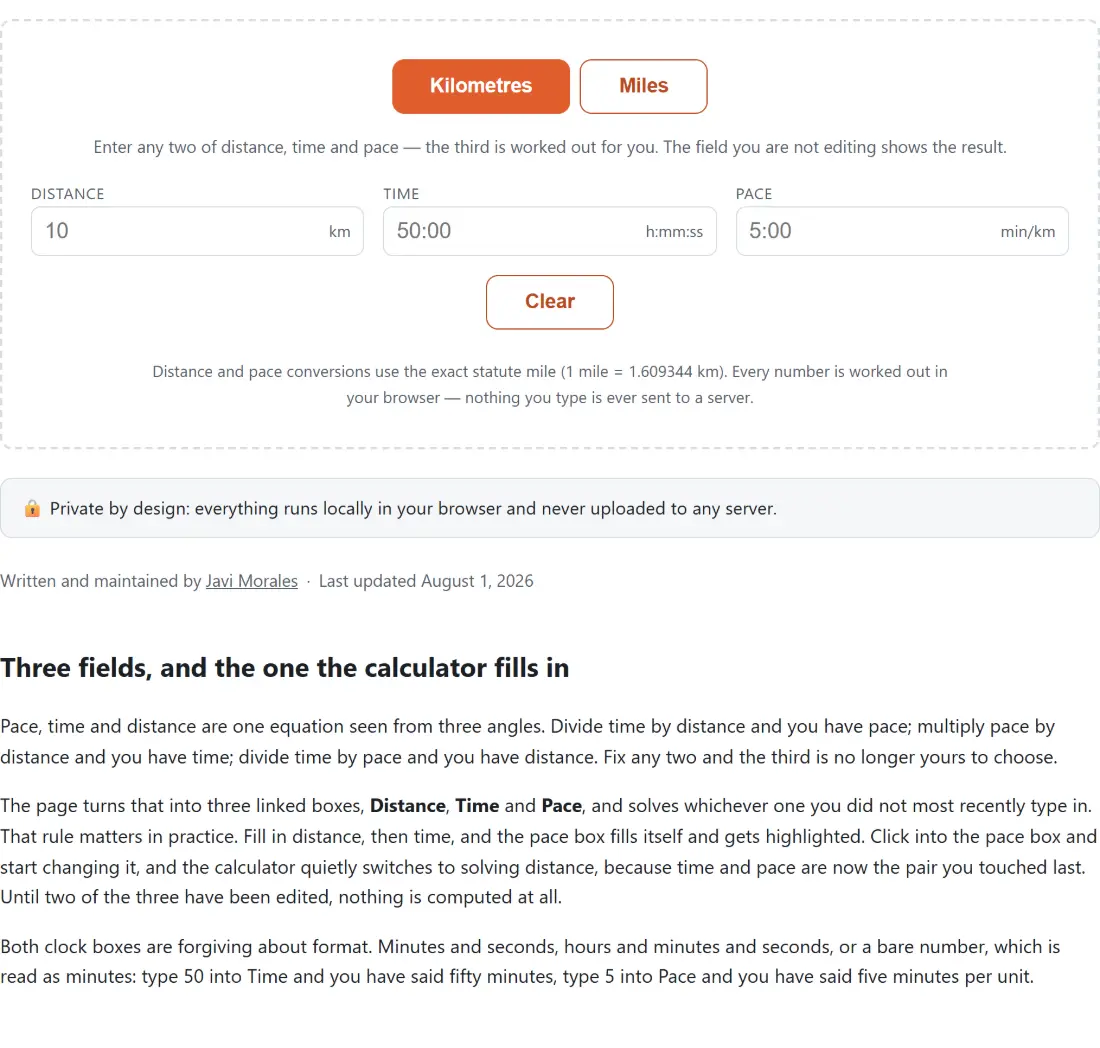
The page turns that into three linked boxes, Distance, Time and Pace, and solves whichever one you did not most recently type in. That rule matters in practice. Fill in distance, then time, and the pace box fills itself and gets highlighted. Click into the pace box and start changing it, and the calculator quietly switches to solving distance, because time and pace are now the pair you touched last. Until two of the three have been edited, nothing is computed at all.
Both clock boxes are forgiving about format. Minutes and seconds, hours and minutes and seconds, or a bare number, which is read as minutes: type 50 into Time and you have said fifty minutes, type 5 into Pace and you have said five minutes per unit.
Working a 10 km in 50:00 through the readout
- Leave the toggle at the top on Kilometres, or press Miles if that is how you think.
- Type 10 into Distance. The suffix on the box tells you the unit it is currently reading.
- Type 50:00 into Time. Pace immediately shows 5:00 and is marked as the calculated field.
- Read the four tiles underneath. Pace 5:00 min/km, pace 8:03 min/mile, speed 12.00 km/h and a treadmill setting of 7.46 mph.
- Below them, the finish times at that pace come out as 25:00 for a 5K, 50:00 for the 10K, 1:45:29 for a half marathon and 3:30:59 for a marathon, followed by a split table with a row for each kilometre. Clear empties all three boxes and starts over.
Every figure in that list comes straight out of the same arithmetic. The per mile pace is the per kilometre pace multiplied by 1.609344, the exact statute mile, and the speeds are 3600 divided by the seconds per unit. There is no model, no coefficient and nothing fitted to data.
Rounding to the nearest second, and where the race table drifts
The one place the numbers can look inconsistent is worth understanding, because it is real and it is not a mistake. Every clock value on the page is rounded to a whole second for display, and the race table and split table are then computed from the pace box as displayed.
Try the classic goal setting case. Put 42.195 into Distance and 4:00:00 into Time, and the pace box returns 5:41 per kilometre. That displayed pace is very slightly faster than the true requirement, and running the full marathon distance at it lands on 3:59:48 in the table below, twelve seconds under the time you typed. Both numbers are correct: one is your actual requirement, the other is what happens if you hold the rounded pace exactly. In the real world nobody holds a pace to the hundredth of a second, so the twelve seconds is noise, but seeing where it comes from beats wondering whether the tool is broken.
Switching to miles without retyping anything
The unit toggle is not a display filter. Pressing Miles converts the number in the distance box and the value in the pace box into their mile equivalents and leaves the time alone, since a finish time is the same however you measure the road. A 10 km run becomes 6.214 miles, a 5:00 per kilometre pace becomes 8:03 per mile, and the split table starts counting mile marks instead of kilometre marks. The race table follows too, listing the half marathon as 13.109 miles.
Work the other way and it behaves the same. Enter 8:00 per mile with the toggle on Miles and the readout gives you 4:58 per kilometre, 12.07 km/h, 7.50 mph, and a constant pace marathon of 3:29:45. If you need to convert something else entirely, speed included, the unit converter handles kilometres per hour, miles per hour and metres per second in one place.
Splits, the partial last row and the 100 row cap
The split table needs both a pace and a distance, and then it lists one row per whole unit plus a final partial row when the distance does not land on a whole number. A half marathon at 5:00 per kilometre produces 22 rows: twenty one full kilometres, then a last row covering the remaining 97.5 metres in 29 seconds, arriving at 1:45:29, exactly matching the race table above it.
Two practical notes. The table is capped at 100 rows, so an ultra distance shows the first hundred marks rather than filling the page. And every split is identical by construction, because this is a constant pace model; if you want a table that varies deliberately, build the plan yourself and use the interval timer to hold each piece on the road.
Constant pace is arithmetic, not a race prediction
The finish times are honest about what they are. They answer one question, how long a distance takes if you hold the entered pace the whole way, and they answer it exactly. They are not equivalent performance predictions, and they do not know that almost every runner fades over a longer distance. Your 5K pace held for 42.195 kilometres is a number, not a plan.
Use the table as a reference point and pace the effort with something that measures your body rather than the road. The heart rate zone calculator will give you training zones either from your age or from a max and resting rate you have actually measured, which is a better guide to whether today’s easy run is genuinely easy. More tools of this kind sit on the calculators hub and in our guide to the online calculators here.