The equation sitting under the maintenance number
Every figure on this page comes out of one formula, the Mifflin-St Jeor equation. It dates from 1990 and displaced the Harris-Benedict equation of 1919 as the default in most nutrition software because it tracks measured resting metabolism more closely across a wider range of body types. It reads:
Men:   BMR = 10 x weight (kg) + 6.25 x height (cm) - 5 x age (years) + 5
Women: BMR = 10 x weight (kg) + 6.25 x height (cm) - 5 x age (years) - 161
BMR is basal metabolic rate, the energy your body spends simply staying alive. Nobody actually lives at their BMR, so the result gets multiplied by an activity factor to reach TDEE, total daily energy expenditure, and that is the number that holds your weight steady.
Filling in the form and reading the report back
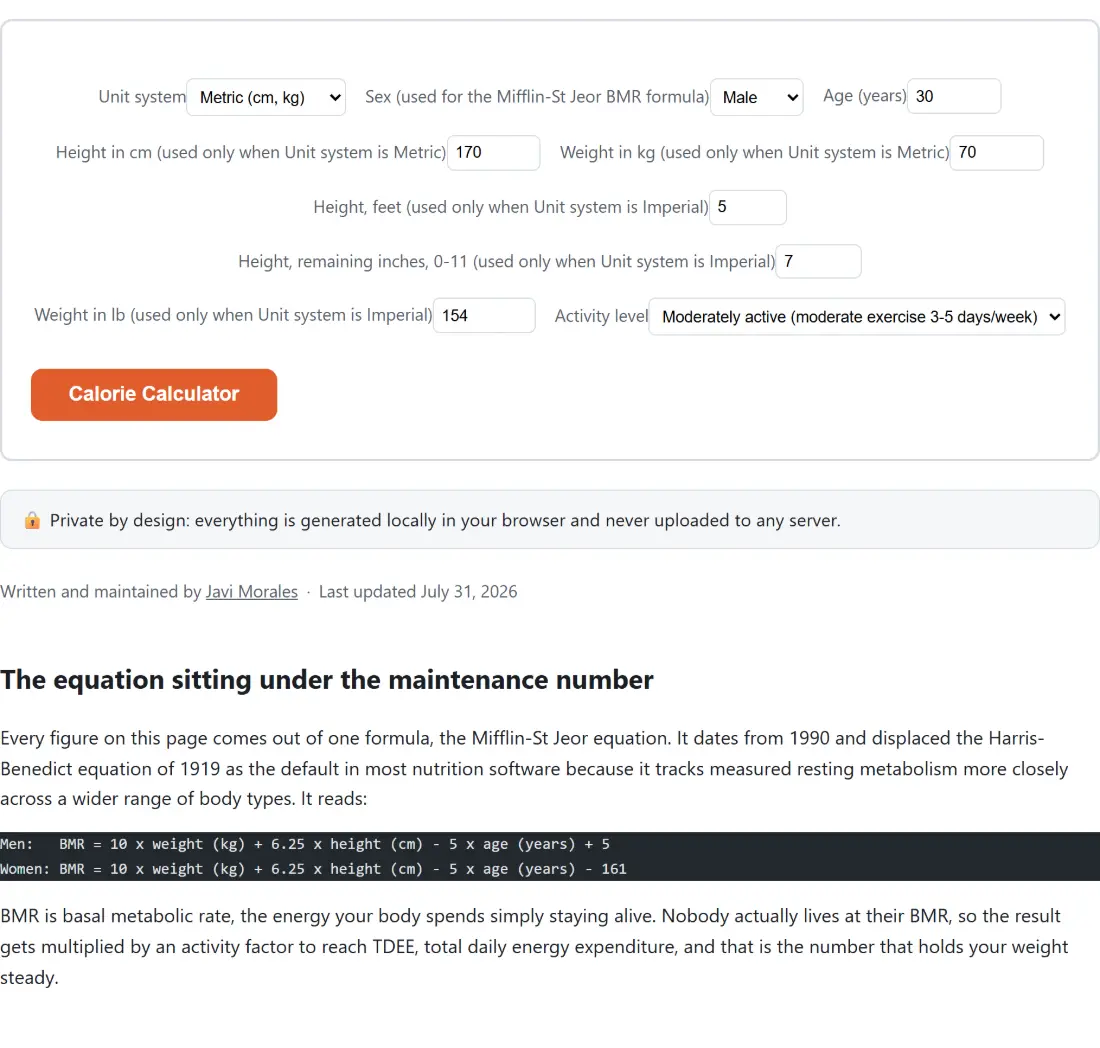
- Set Unit system to Metric (cm, kg) or Imperial (ft/in, lb). Only the fields belonging to the system you chose are read, so you never have to convert your own measurements first.
- Enter your sex, age, height and weight. Imperial height is split across two fields, whole feet and the remaining inches.
- Pick an Activity level. It starts on Moderately active (moderate exercise 3-5 days/week).
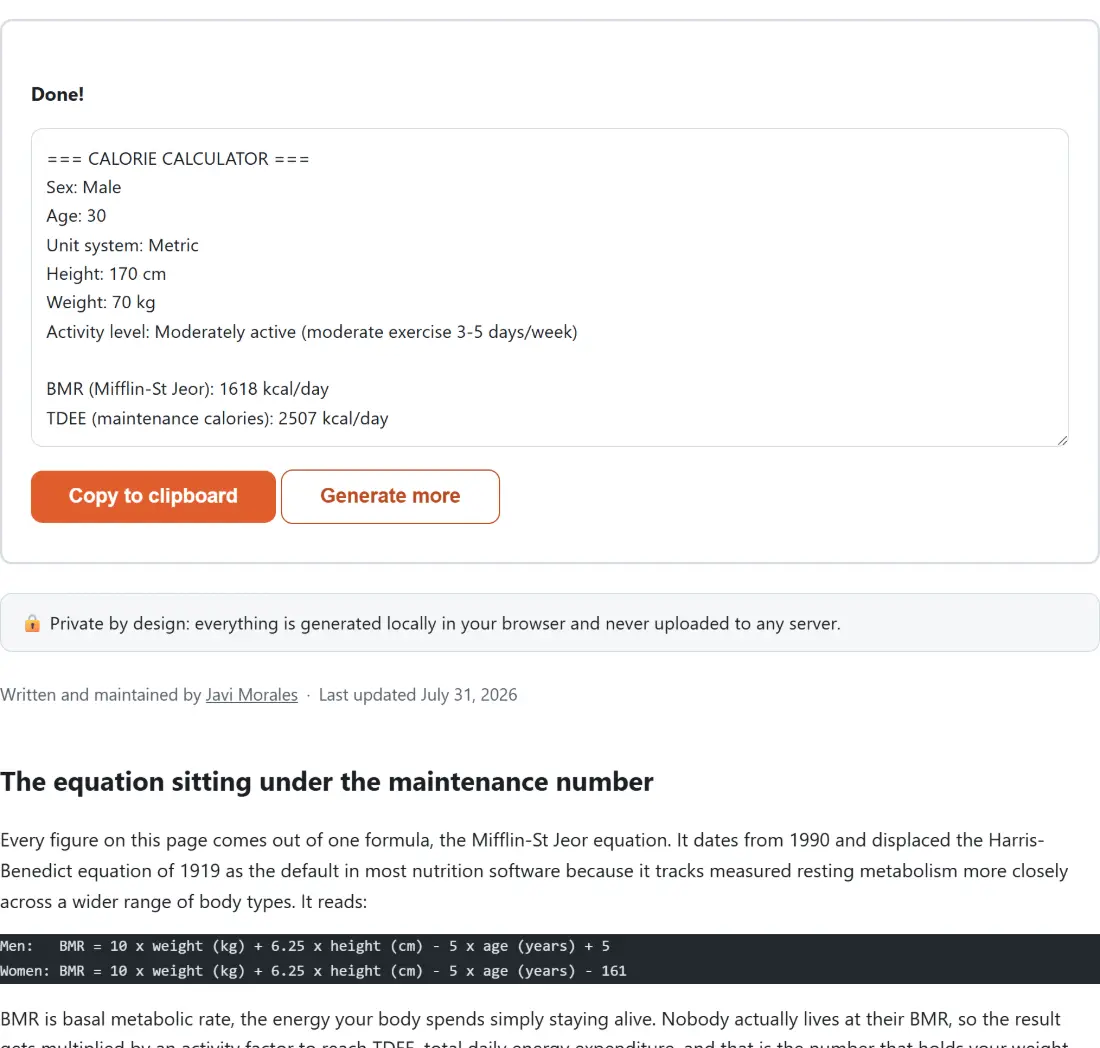
- Click Calorie Calculator. The report appears in a read-only box with Copy to clipboard underneath.
Imperial input is converted with the exact definitions, 1 lb = 0.45359237 kg and 1 in = 2.54 cm, so entering the same body in either system produces the same BMR, TDEE and calorie figures, with only the echoed input lines reading differently. What comes back is plain text in four labelled blocks: your inputs and BMR, the daily calorie targets, your TDEE at every activity level, and a disclaimer that travels with the text if you paste it somewhere else.
Five multipliers, and the guess that moves the number most
| Activity level | Multiplier | Description |
|---|---|---|
| Sedentary | 1.2 | Little or no exercise |
| Lightly active | 1.375 | Light exercise 1-3 days/week |
| Moderately active | 1.55 | Moderate exercise 3-5 days/week |
| Very active | 1.725 | Hard exercise 6-7 days/week |
| Extra active | 1.9 | Very hard exercise or a physical job |
Those five values are the conventional set, and the spread between the ends is large: 1.9 divided by 1.2 is a little over 1.58, so the same body at the top of the scale is credited with more than half again the maintenance calories it gets at the bottom. Nothing else you type swings the answer that far, which is why the report prints all five figures with an arrow marking the level you selected. In practice the honest reading is to look at the two levels either side of your pick and treat the range between them as the real answer.
Bands rather than one prescriptive target
The goal figures are a fixed offset from your TDEE, not a percentage of it: a mild 250 calories a day and a more standard 500. Losing weight runs from TDEE minus 500 up to TDEE minus 250, gaining runs from TDEE plus 250 up to TDEE plus 500, and maintaining is simply the TDEE itself. Each end carries the weekly weight change it implies, using the rule of thumb that a kilogram of body tissue is worth about 7,700 calories. A 500-a-day offset works out to about 0.45 kg (1.00 lb) a week and a 250-a-day offset to about 0.23 kg (0.50 lb); the pound figure is converted from the kilogram figure rather than computed from a second rounded constant, so the two units can never contradict each other.
Worked through, a 35-year-old man of 180 cm and 82 kg who selects lightly active gets a BMR of 1,775 and a TDEE of 2,441 calories a day, a weight-loss band of 1,941 to 2,191 and a weight-gain band of 2,691 to 2,941. If you would rather turn a daily target into grams of protein, carbohydrate and fat, the Macro Calculator runs the same Mifflin-St Jeor pipeline and then applies a percentage-based goal adjustment instead of these fixed offsets, so its numbers will not line up exactly with the bands here.
The floor underneath every weight-loss target
Weight-loss targets are capped from below at 1,500 calories a day for men and 1,200 for women, the conventional (if dated and widely argued over) minimums. The floor touches only the two ends of the loss band: maintenance is meant to reflect your own estimate, and a surplus is above it by construction. When the floor actually raises a line, the report marks that line and recalculates the weekly rate from the deficit that is genuinely left, not from the nominal 250 or 500, so a floored target never advertises a rate it no longer implies.
Where a population-level estimate stops being useful
This is arithmetic on four inputs, not an assessment of you. Two people with identical height, weight, age and sex can have genuinely different energy needs, and the weekly rates are a linear approximation of something that is not linear: real weight change slows as your body adapts. Treat the output as a starting point to test against a few weeks of actual results rather than a prescription. For a different angle on the same measurements, the BMI Calculator places your height and weight on the standard scale, and the rest of the calculators cover training and everyday conversions. None of this is medical or nutrition advice; if you have questions about your weight, your diet or your health, ask a doctor or a registered dietitian.