Compound Interest Calculator

Project compound growth from principal, rate, term, compounding and contributions, with a growth chart and year-by-year table. Free and private.

🌐 Español

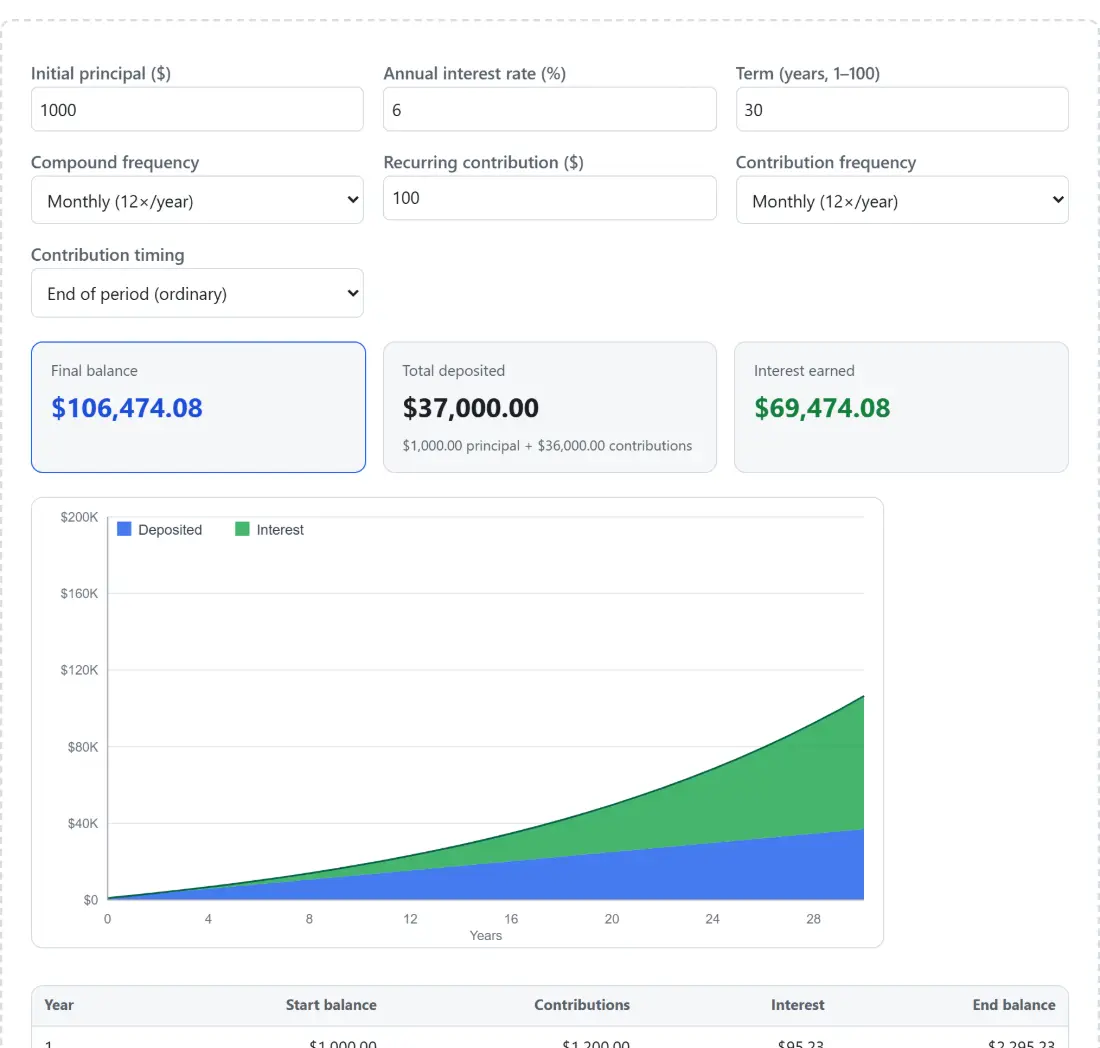
Final balance$106,474.08
Total deposited$37,000.00$1,000.00 principal + $36,000.00 contributions
Interest earned$69,474.08
$0 $40K $80K $120K $160K $200K 0 4 8 12 16 20 24 28 Deposited Interest Years
YearStart balanceContributionsInterestEnd balance
1$1,000.00$1,200.00$95.23$2,295.23
2$2,295.23$1,200.00$175.12$3,670.36
3$3,670.36$1,200.00$259.94$5,130.29
4$5,130.29$1,200.00$349.98$6,680.27
5$6,680.27$1,200.00$445.58$8,325.85
6$8,325.85$1,200.00$547.08$10,072.93
7$10,072.93$1,200.00$654.83$11,927.76
8$11,927.76$1,200.00$769.23$13,897.00
9$13,897.00$1,200.00$890.69$15,987.69
10$15,987.69$1,200.00$1,019.64$18,207.33
11$18,207.33$1,200.00$1,156.54$20,563.88
12$20,563.88$1,200.00$1,301.89$23,065.77
13$23,065.77$1,200.00$1,456.20$25,721.97
14$25,721.97$1,200.00$1,620.03$28,542.00
15$28,542.00$1,200.00$1,793.96$31,535.96
16$31,535.96$1,200.00$1,978.63$34,714.59
17$34,714.59$1,200.00$2,174.68$38,089.27
18$38,089.27$1,200.00$2,382.82$41,672.09
19$41,672.09$1,200.00$2,603.80$45,475.88
20$45,475.88$1,200.00$2,838.41$49,514.29
21$49,514.29$1,200.00$3,087.49$53,801.78
22$53,801.78$1,200.00$3,351.93$58,353.72
23$58,353.72$1,200.00$3,632.69$63,186.40
24$63,186.40$1,200.00$3,930.76$68,317.16
25$68,317.16$1,200.00$4,247.21$73,764.37
26$73,764.37$1,200.00$4,583.18$79,547.55
27$79,547.55$1,200.00$4,939.87$85,687.42
28$85,687.42$1,200.00$5,318.57$92,205.99
29$92,205.99$1,200.00$5,720.62$99,126.61
30$99,126.61$1,200.00$6,147.47$106,474.08

These figures are estimates from a fixed-rate projection, not financial advice. Taxes, inflation, and fees are not included, and real returns vary. Consult a qualified financial professional before making financial decisions.

🔒 Private by design: everything runs locally in your browser and never uploaded to any server.

Compound interest is interest paid on interest. The balance grows, next period’s interest is calculated on the larger balance, and the curve that starts almost flat bends upward late. Everyone knows the shape. What most calculators hide is what happens when your deposits and your bank’s compounding dates do not line up, which is the normal case rather than the exception.

The seven fields, and the three totals they drive

  1. Enter Initial principal ($), the amount you are starting with, which may be zero.
  2. Enter the Annual interest rate (%) and the Term (years, 1–100).
  3. Choose a Compound frequency, from Annually (1×/year) through Daily (365×/year), with monthly preselected.
  4. Set a Recurring contribution ($) and a Contribution frequency, which runs from Weekly (52×/year) down to Annually (1×/year), or None to project a lump sum on its own.
  5. Pick a Contribution timing of End of period (ordinary) or Start of period (annuity due).

There is no calculate button. Final balance, Total deposited and Interest earned update as you type, along with the growth chart and the year-by-year table underneath.

A shared clock built from the least common multiple

The tidy formula in every textbook assumes your deposits arrive on exactly the same schedule as the compounding, and it divides by the rate. This tool allows neither assumption, so it steps through the account instead.

It builds a clock of equal sub-periods per year whose count is the least common multiple of the two frequencies. Monthly deposits with quarterly compounding give twelve sub-periods a year; weekly deposits with monthly compounding give 156. Interest is credited only at the compounding boundaries, as the balance times the rate divided by the compounds per year. Deposits land at their own boundaries, before that period’s interest under the annuity-due convention and after it under the ordinary one.

When the two frequencies do match, the simulation reproduces the closed form to well inside a hundredth of a cent, so the flexibility costs nothing in accuracy. And the difference the mismatch makes is real but modest: take the default projection and switch compounding from monthly to quarterly while leaving the deposits monthly, and the ending balance moves from 106,474.08 to 106,349.64.

End of period against start of period, in dollars

The two timing conventions have proper names. End of period (ordinary) is an ordinary annuity: the deposit is added after that period’s interest, so it earns nothing in the period it was made. This is the usual default for savings contributions and it is what the form opens on. Start of period (annuity due) adds the deposit before interest, buying each one an extra period of growth.

On the default figures that is the difference between 106,474.08 and 106,976.34. Around five hundred dollars over thirty years, from a convention rather than a decision, which is a reasonable illustration of why it is worth knowing which one your actual account uses before comparing two projections.

Reading the year rows without expecting bit-perfect arithmetic

The table gives every year a start balance, that year’s contributions, that year’s interest, and the end balance. Year one of the default projection reads 1,000.00, 1,200.00, 95.23, 2,295.23. Year thirty reads 99,126.61, 1,200.00, 6,147.47, 106,474.08, and that last figure is exactly the headline total.

Two honest notes about those numbers. The running balance and the two yearly subtotals are accumulated in a different order, so within a row they agree only to floating-point tolerance, of the order of a hundred-billionth of a dollar in this projection rather than exactly. Rounding each cell to cents for display then leaves some rows looking a cent adrift, and 7 of the 30 rows in this projection do. The projection itself keeps full precision from beginning to end.

The chart above the table splits the same data into two stacked bands, blue for everything you deposited and green for the interest on top, running to the balance line. On a long term the visual point makes itself: on the default projection the green band is a thin sliver for the first few years, passes a quarter of the column height by year ten, and is about two thirds of it by year thirty.

A zero percent rate is a legitimate input, not an error

Set the rate to zero and the projection still works, because nothing in the simulation ever divides by the rate. The final balance becomes exactly what you put in, 37,000 on the default figures, and interest earned reads zero. That is genuinely useful as a baseline: run it once at zero to see your own money, then at your real rate, and the gap between the two is the entire case for starting early.

Taxes, inflation and fees are all absent on purpose

The projection assumes one fixed rate for the whole term, and it models no tax on interest, no inflation eroding purchasing power, and no account fees. Real returns vary year to year and are usually lower than a smooth curve suggests. These are estimates for comparing scenarios, not a forecast and not financial advice; the page repeats that in a disclaimer under the results, and anything consequential belongs with a qualified professional.

For the rest of the picture, work out where the monthly contribution actually fits with the budget planner, price a loan running the other direction with the mortgage calculator, and check a plain rate change with the percentage calculator. The full calculators hub collects the rest.
See it in action

Screenshot of the Compound Interest Calculator tool with initial principal, annual rate and a term of 1 to 100 years, with the compounding frequency chosen from annually, semiannually, quarterly, monthly or daily, and the growth worked out from those inputs
Compound Interest Calculator mid-process: initial principal, annual rate and a term of 1 to 100 years, with the compounding frequency chosen from annually, semiannually, quarterly, monthly or daily, and the growth worked out from those inputs.
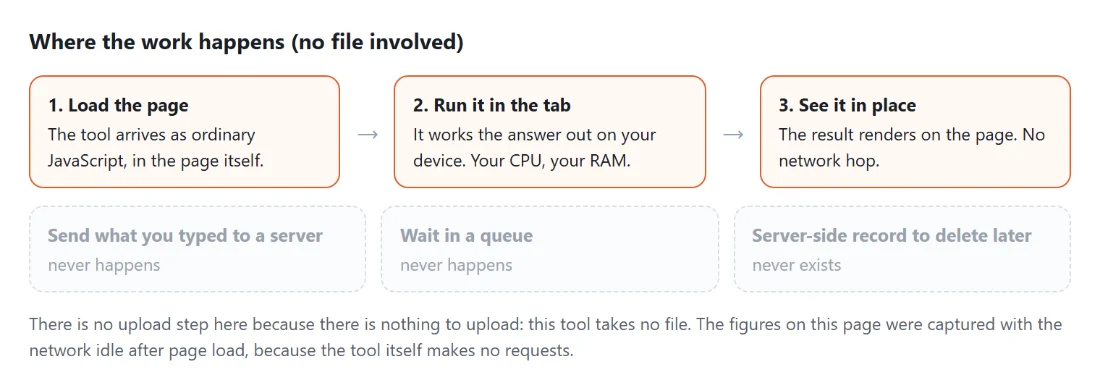
Diagram: where the work happens on a SysFenix page that has no file input at all: the tool arrives as ordinary JavaScript inside the page, works the answer out on your own device and renders it in place, so the upload, queue and server-side record a typical online tool needs never happen
Where the work happens on a SysFenix page that has no file input at all: the tool arrives as ordinary JavaScript inside the page, works the answer out on your own device and renders it in place, so the upload, queue and server-side record a typical online tool needs never happen.

Frequently asked questions

Can my contributions be on a different schedule from the compounding?

Yes, and supporting that is the reason this calculator simulates rather than plugs into a formula. The textbook annuity formula is only valid when the two frequencies match, so instead the projection runs on a shared clock whose length is the least common multiple of the two. Interest lands at the compounding boundaries, deposits land at their own, and money deposited between two compounding dates simply earns its first interest at the next one.

What are the starting numbers on the page, and what do they add up to?

The form opens with 1,000 of principal, 6 percent, a 30 year term, monthly compounding, and 100 added monthly at the end of each period. That projection ends at 106,474.08. Of that, 37,000 is money you put in, being the 1,000 principal plus 36,000 in contributions, and 69,474.08 is interest. Every one of those figures comes straight from running the calculator with its own defaults.

How much difference does the contribution timing dropdown really make?

Less than people expect, but not nothing. Switching the default projection from end of period to start of period moves the final balance from 106,474.08 to 106,976.34, a gain of 502.26 across thirty years. Each deposit collects one extra period of interest, and with monthly periods one extra month of growth per deposit is a small edge that compounds quietly rather than a dramatic one.

Does the year-by-year table add up to the penny?

Not every row. The last row's end balance is exactly the headline final balance, but within a row the three components are accumulated separately from the running balance, and each cell is then rounded to cents on its own for display. On the default projection 7 of the 30 rows read a cent out because of that. It is a display artifact, not an error in the projection, which carries full precision throughout.

Is a 0 percent rate going to break the calculation?

Not at all. The simulation multiplies the balance by the periodic rate rather than dividing by it, which is the step the closed-form annuity formula stumbles on, so a zero rate credits zero interest and carries on. With the default figures at 0 percent the final balance is 37,000, exactly the money deposited, and interest earned reads zero. It is a quick way to see how much of a projection is your own contributions.

Does anything I type here get sent anywhere?

No. The whole projection, the chart and the table are computed by plain arithmetic in the page itself, recalculated on each keystroke, with no request leaving the tab and no account to create. Your target balance and contribution amounts are exactly the sort of figures worth not handing to an ad-funded calculator site, so this one has nowhere to send them.

Related tools