The preset categories, and the three groups they sort into
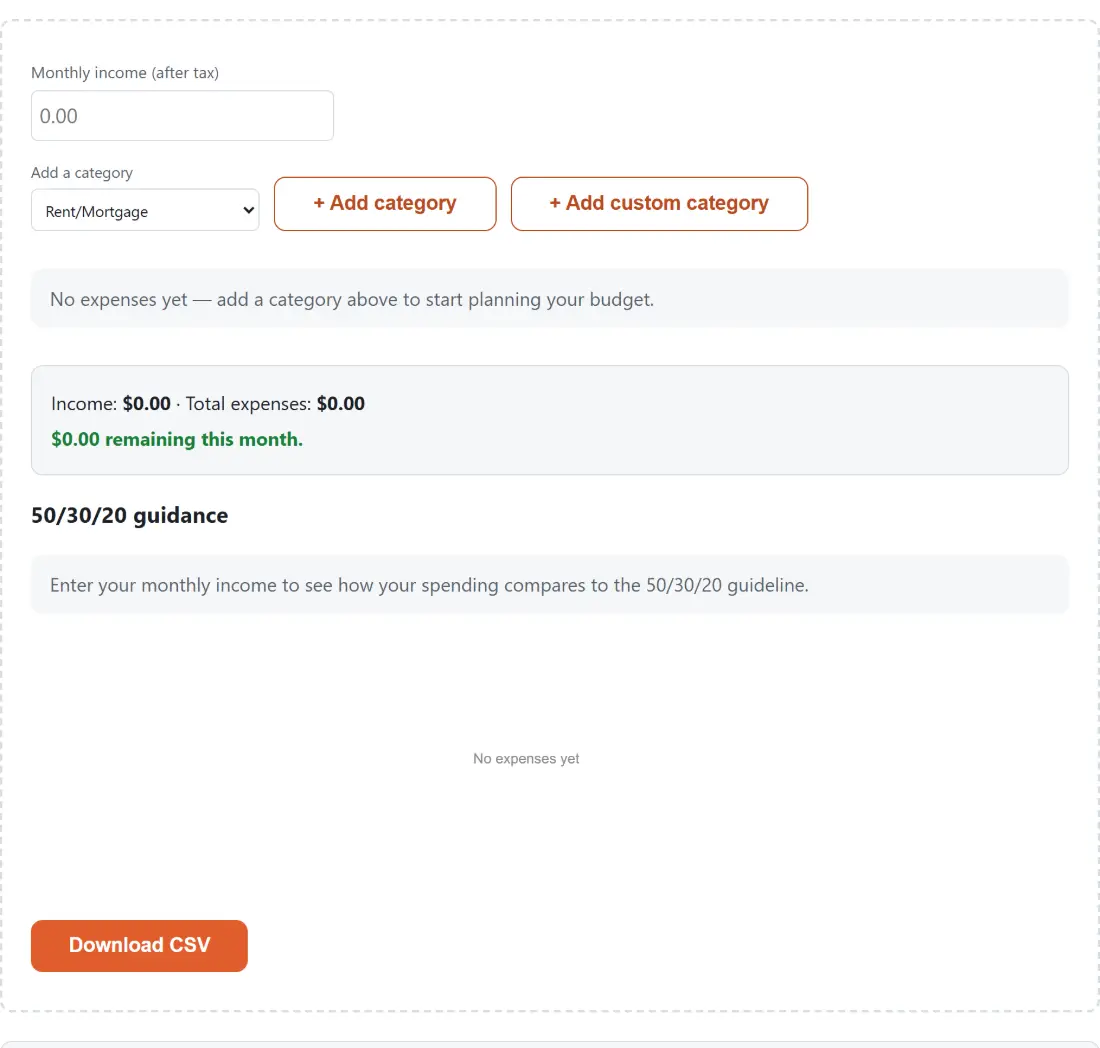
The Add a category dropdown is itself grouped into Needs, Wants and Savings, and every entry arrives pre-tagged with the group it usually belongs to. Needs holds rent or mortgage, groceries, utilities, transportation, insurance, minimum debt payments and healthcare. Wants holds dining out, entertainment, shopping, subscriptions, travel and hobbies. Savings holds an emergency fund, retirement, investments and extra debt payoff beyond the minimum.
Those defaults are a starting classification, not a verdict. Every row carries its own group dropdown, so a category can be moved between the three at any time, and often it should be. A car payment is a need for someone who drives to work and a want for someone who bought a second car for weekends. + Add custom category creates a blank row you can name yourself; it starts in Wants, which is the safer of the three to have to correct.
Setting up a month of categories
- Type your take-home pay into Monthly income (after tax). Until it is above zero, the guidance table is replaced by a note, because a percentage of nothing is undefined rather than zero.
- Choose an entry in Add a category and click + Add category, or click + Add custom category and name the row yourself.
- Fill in the amount on each row, and change that row’s group if the preset does not match how the expense actually works for you.
- Read the line under the rows. It reads either as an amount remaining this month or as an amount over budget, never as a bare negative number you have to interpret.
- Drop a row you do not need using the small remove control at its right-hand end.
The donut below the guidance table splits total spending across the three groups and keeps each group’s colour fixed, so Savings is the same colour whether or not Needs has anything in it yet. With no expenses entered it says so in words rather than drawing an empty wedge.
Percentages measured against income, not against your own spending
This is the part most 50/30/20 calculators get wrong, and it changes the answer. Every percentage in the guidance table divides a group total by your income, never by your total expenses. Divide by expenses and the three figures always add up to 100 percent, which describes the shape of your spending but says nothing about whether there is too much of it. Divide by income and they add up to however much of your income you have committed, which is what the rule was written about.
Worked through: on an income of 4,000 with 2,500 in needs, 800 in wants and 200 in savings, this tool reports 62.5, 20 and 5 percent of income, with 500 left over. Dividing by the 3,500 of expenses instead would have produced 71.4, 22.9 and 5.7 percent, three numbers that look like an answer while hiding the fact that an eighth of the income was never allocated at all. The table then sets each figure next to its 50, 30 or 20 target and marks the row above guideline or at or below guideline.
Where the status column stops being helpful
For Needs and Wants that comparison is exactly what you want: more than half your income on needs, or more than 30 percent on wants, is precisely the signal the rule exists to raise. For Savings it runs the wrong way round for most people’s intent. Putting 5 percent of your income aside is reported as at or below guideline, which is literally true and is not praise. Read the Savings row as a number to grow, not a ceiling to stay under.
Two more limits are worth stating plainly. Everything is monthly, so an annual insurance premium or a quarterly bill has to be divided down before it goes in, and a negative amount is stored as zero rather than as an offsetting credit. And the figures carry a plain dollar sign with no currency selector, because none of the arithmetic depends on which currency your numbers are actually in.
Where the budget is kept, and how to get it out
Every change writes the whole budget, income and all rows, into this browser’s local storage under a single key, and it is read back when you return, so closing the tab is not the same as losing the plan. There is no account and no sync, which ties the budget to this browser on this device; clearing site data or opening the page in a private window starts you at a blank sheet. Where local storage is unavailable altogether, the tool still works for the session and quietly stops persisting.
Download CSV writes a file with a type, category, group and amount column, one row for the income and one per expense. That is both the backup and the escape hatch: it opens in any spreadsheet, and the CSV viewer opens it here without one. For the individual sums a budget usually sits next to, the percentage calculator handles the raise or the rent increase, the compound interest calculator projects what the savings row turns into over years, and the mortgage calculator produces the monthly payment figure that goes on the housing row in the first place.
None of this is financial advice. It is arithmetic applied to numbers you typed, against a well known rule of thumb; it knows nothing about your debts, your goals or your local cost of living, and a real plan is a conversation with a qualified professional.