From a DevTools export to a sortable table
- Drop the capture onto Drop your .har file here, or click Choose a file. In Chrome or Edge you produce one from the Network panel with “Save all as HAR with content”; Firefox offers the same thing as “Save All As HAR” in its own right-click menu.
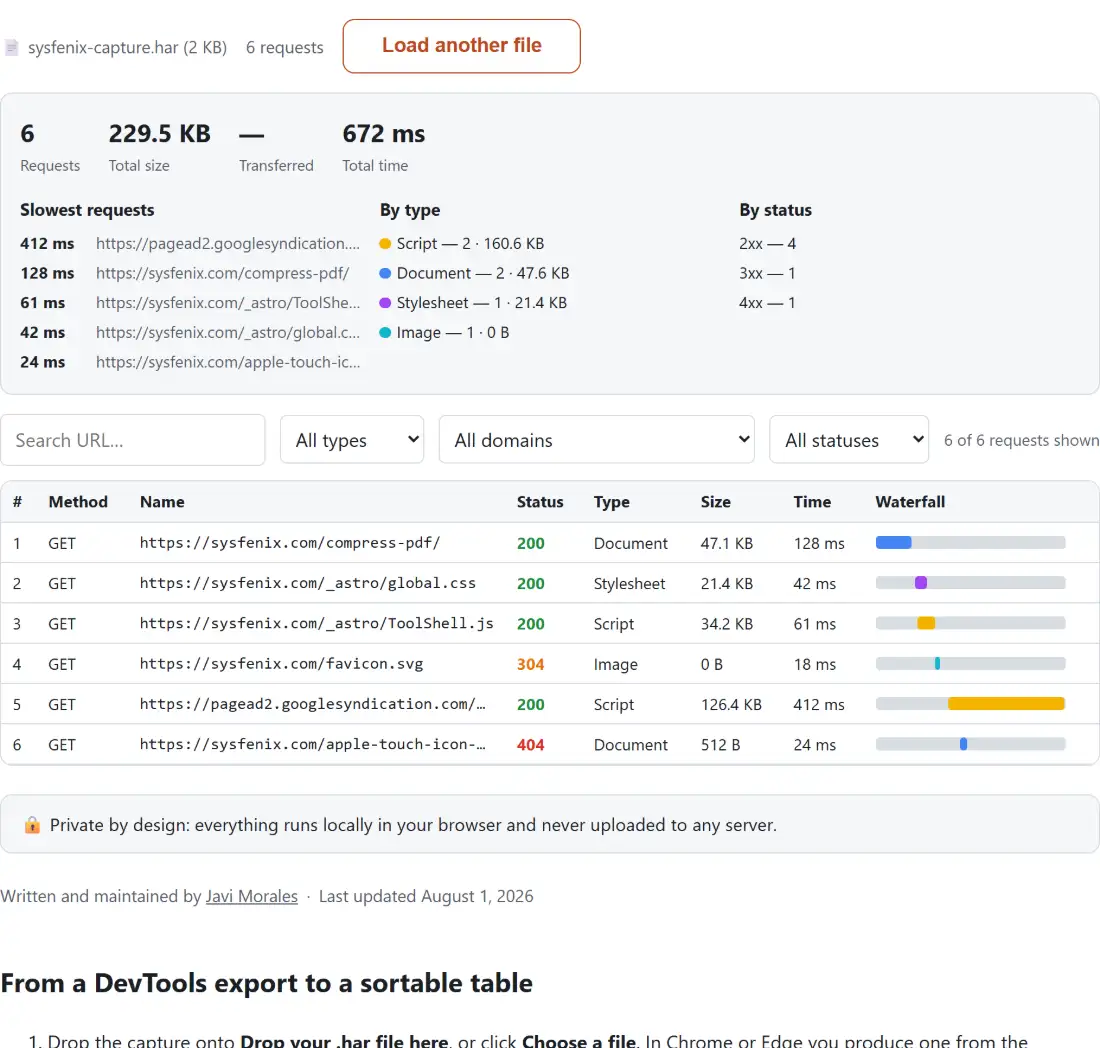
- Read the four tiles across the top, Requests, Total size, Transferred and Total time, and the three panels underneath them, Slowest requests, By type and By status. Rows in the slowest list are clickable and load that request into the detail panel below the table.
- Narrow the table with the URL search box and the All types, All domains and All statuses dropdowns. A counter to their right keeps saying how many of the total requests are currently shown.
- Sort by clicking a header: Method, Name, Status, Type, Size, Time, or the # column to get back to capture order. One click sorts ascending, a second flips it, a third clears the sort. The Waterfall column is not sortable.
- Click any row to open the detail panel underneath, which carries the full URL, the status text, the MIME type, the size figures, the timing breakdown and every captured request and response header, each list labeled with its own count.
- Load another file clears the table and brings the drop zone back.
The four numbers in the summary strip
Requests is the count of entries that survived parsing. Total size adds up each response’s uncompressed body length. Total time is wall clock across the whole capture rather than the sum of the durations, which is the distinction most often misread and is spelled out in the FAQ below.
Transferred is the odd one out, because it comes from a Chrome-specific field rather than the HAR specification, and a capture that lacks it shows a dash rather than a fabricated zero. When both numbers are present, comparing them is the quickest compression check a HAR file will give you: a total size far above the transferred figure means gzip or brotli is working, and two numbers sitting close together on text-heavy responses usually means it is not enabled.
Where Type, Size and Time each come from
Classification prefers the resource-type hint Chrome writes into its own exports, since the browser knows what it asked for. When that hint is missing, or holds a value outside the recognized set, the MIME type decides instead, and text/html becomes Document, text/css becomes Stylesheet, image/anything becomes Image, and JSON or XML responses land under XHR and Fetch. A failed request with no MIME type at all ends up in Other rather than being guessed at, which is the honest answer.
Size reads the response’s own content length, falls back to the body size when a capture did not record content separately, and settles on zero only when neither field is usable. That figure is the uncompressed body, not the bytes on the wire. Time is the entry’s total duration, and the detail panel splits it into the phases the capturing tool actually measured, in the fixed order blocked, DNS, connect, SSL, send, wait and receive. Phases marked as not applicable are dropped, while a genuine zero-millisecond phase is kept, because those two are different facts.
One bar per request, one color per type
The bar in the last column is positioned by when the request started and sized by how long it ran, both measured against the span from the earliest start to the latest finish in the file. Read down the column and you can see which requests overlapped, which fired late, and which single bar stretches on while everything else has finished.
It is deliberately one flat color per resource type rather than a segmented DevTools-style bar, and very short requests are drawn at a minimum width so they do not vanish. For the phase-level detail the color is not showing, click the row. A request whose start time could not be parsed is drawn with no bar at all rather than a misleading one.
A HAR export is a copy of your logged-in session
This is worth pausing on before you use any HAR tool, this one included. A capture records request and response headers verbatim, so it routinely contains session cookies, Authorization bearer tokens, CSRF tokens and any API key that traveled as a header or a query parameter. Anyone holding the file can replay those credentials while they remain valid, which makes it closer to a password export than to a log file.
Here, the file is read with the browser’s File API, parsed with JSON.parse, and rendered into a table by code already running in your tab, with no transmission step anywhere in that path. That is also why the detail panel prints every header it finds without redaction: on your own machine that is the useful behavior, and it would be reckless anywhere else. Redact before you attach a HAR to a ticket, and treat one that arrives in a bug report as a live secret.
What it skips, warns about, or refuses to open
The parser is deliberately forgiving about individual entries and strict about the file. A single entry with no request object, no response object or no URL is dropped and counted in a warning line above the summary, so one bad record in a long capture never costs you the other thousand. A file that is not JSON, or is JSON without a log.entries array, stops the load with a message naming the specific problem rather than a generic failure.
The size ceiling is 100 MB, measured on the decoded text after the browser has handed it over and before parsing begins. The table itself has no row limit worth naming, because only the rows in the viewport are rendered, and every filter change jumps the scroll position back to the top so a shortened result set never leaves you staring at blank space.
For the questions this page cannot answer, four neighbors help. The JSON Tree Viewer opens the same .har file directly, which is how to inspect fields this table does not surface, such as post data or cache metadata. A response body worth reformatting can be pasted into the JSON Formatter & Validator, which takes text rather than a file. When the browser’s account of a request disagrees with the origin’s, the Server Log Analyzer reads Nginx and Apache access logs from a .log or .txt file. And a saved binary response body opens in the Hex Viewer whatever its extension.