Two faults, and neither is obvious until you look for it
Touchscreens fail in two characteristic ways, and both are frustrating precisely because they are intermittent enough to make you doubt yourself.
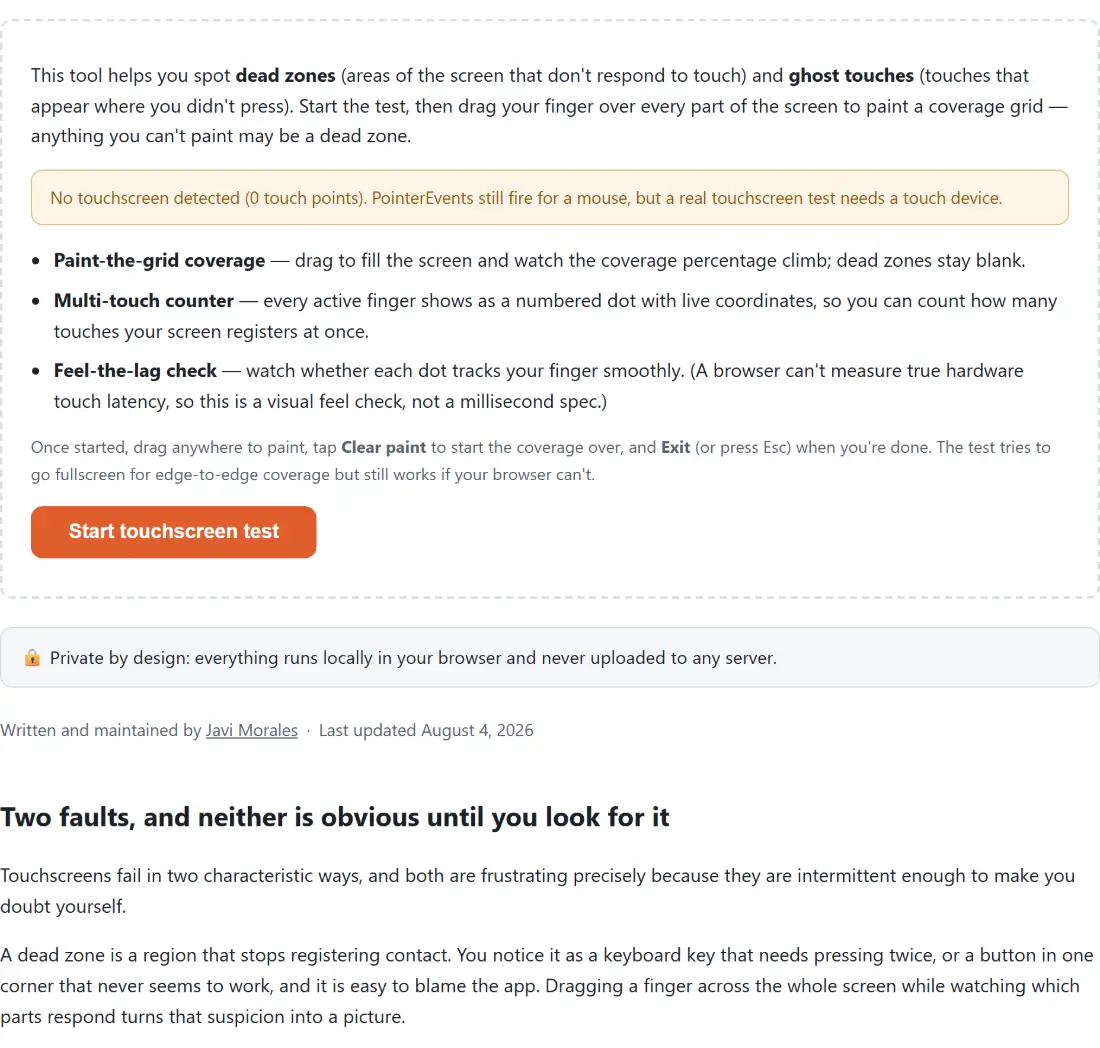
A dead zone is a region that stops registering contact. You notice it as a keyboard key that needs pressing twice, or a button in one corner that never seems to work, and it is easy to blame the app. Dragging a finger across the whole screen while watching which parts respond turns that suspicion into a picture.
A ghost touch is the opposite, a contact the screen reports that you did not make. It shows up as a cursor jumping, a menu opening on its own or typing appearing from nowhere. Seeing an extra dot on screen while your hands are still is a very different level of evidence from noticing odd behaviour.
Running the test
- Read the touch point figure at the top. It tells you what your hardware supports before you start.
- Press start. The page attempts to go fullscreen for edge to edge coverage.
- Drag a finger over every part of the screen and watch the coverage percentage climb.
- Look for patches that will not fill in. Those are the candidates.
- Put several fingers down at once and check the count against what you actually placed.
- Use clear paint to start the coverage over, and exit or press escape when you are done.
What the readout is telling you
Three things sit in the corner while the test runs.
The coverage percentage is the proportion of grid cells that have been touched. It will not reach a hundred without deliberate effort, so treat a stubborn gap rather than a number below a hundred as the signal.
The current touch count and the maximum seen this run are the multi-touch half. The maximum matters more than the current figure, because a ghost touch that appears for a fraction of a second is gone before you can look at it but is still recorded in the maximum.
The event to handler timing is shown when available and is explicitly labelled as browser processing time rather than hardware latency, for the reason set out below.
The latency claim other tools make, and why this one does not
Touch latency is the interval between your finger moving and the display updating. It includes the digitiser’s scan rate, the operating system’s input pipeline, the browser’s own scheduling, the compositor and the panel’s response time. A web page sits in the middle of that chain and can see almost none of it.
What a page can measure is the gap between the timestamp the browser put on the event and the moment its own handler ran. That is a real number and it is not the one people want, because it is typically well under a millisecond and reflects the browser being busy rather than the screen being slow.
Reporting it as touch latency would be a fabrication, so it is shown with its actual meaning attached and the real lag check is left as a visual one. Watching whether the dot keeps up with your finger tells you more about a laggy screen than a millisecond figure that measured the wrong thing.
The rest of the hardware checks
A screen fault is not always a touch fault. If the problem looks like a mark or a stuck colour rather than a lack of response, Dead Pixel Test fills the screen with flat colours to expose it.
For the input devices on a machine without a touchscreen, Keyboard Tester shows every keypress and Mouse Tester covers buttons, scrolling and movement. For a controller, Gamepad Tester reads every axis and button live. The rest are on the testers hub.