dBFS, SPL, and the measurement a browser cannot make
This is the part worth reading before anything else. A proper sound level meter is a calibrated instrument: it knows how many pascals of pressure correspond to how many volts at its microphone, so it can report a number that means the same thing in your classroom as in mine. A web page has none of that. What it receives is a stream of normalized samples, numbers in a range of roughly minus one to one, whose absolute size depends on the microphone hardware and on whatever gain the operating system happened to apply.
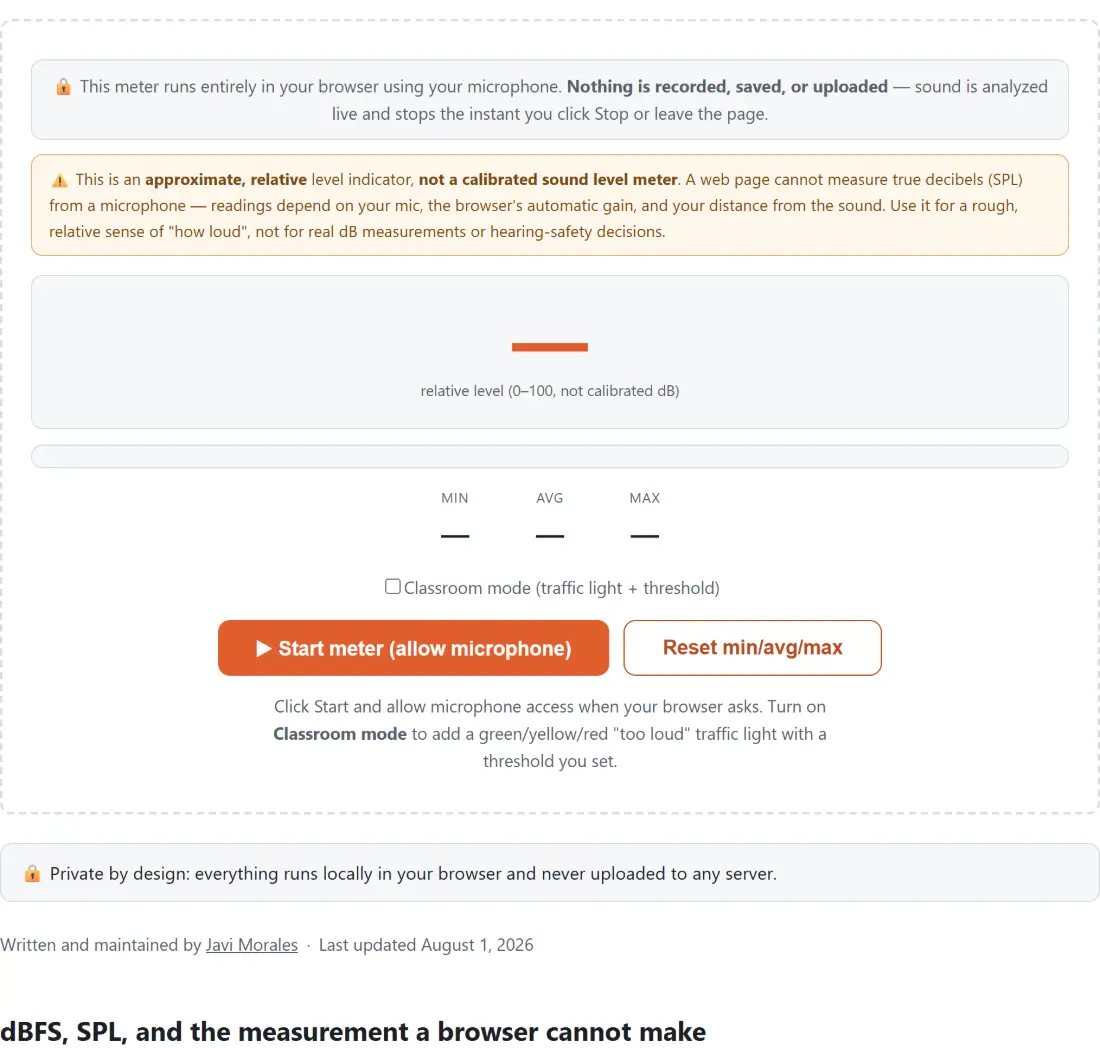
What can be computed honestly from those samples is the RMS of the window, and from the RMS a value in dBFS, decibels relative to full scale, which is always at or below zero. That is a real measurement of the signal. It is not a measurement of the room. The friendly 0 to 100 number on screen is that dBFS figure shifted up by one hundred, which is why the tool prints the raw dBFS alongside it rather than hiding it.
So use this to answer “is it louder than it was two minutes ago” and “which of these two spaces is noisier right now”. Do not use it to answer “is this legally too loud”, because it cannot.
From a 2048-sample window to the number on screen
Each animation frame pulls a 2048-sample window of time-domain data out of the analyser, which is around 46 milliseconds of audio at a 44.1 kHz sample rate. The square root of the mean of the squared samples gives the RMS, and twenty times its base ten logarithm gives dBFS. Silence would send that logarithm to negative infinity, so anything at or below the floor is reported as the floor instead.
Raw per-frame values jump around too much to read, so the dBFS figure is smoothed before anything is displayed: each new value is folded into the previous one with an exponential moving average that closes a fifth of the remaining gap every frame. The smoothed dBFS is what gets shifted up by one hundred to produce the number on screen, and it is the value printed underneath it. The min, avg and max figures are updated on a separate, slower schedule, at most ten times a second, so that the average reflects elapsed time rather than however fast your display happens to repaint.
Setting a classroom threshold that fires when you want it to
- Click ▶ Start meter (allow microphone) and accept the permission prompt your browser puts up.
- Watch the large figure and the bar for a minute of ordinary activity. Note roughly where the number sits when the room is behaving.
- Tick Classroom mode (traffic light + threshold), then drag the Too-loud threshold slider to a little above that observed value. The slider runs from 20 to 95 and starts at 60.
- From then on the readout reads OK below the yellow band, Getting loud within ten points of your threshold, and TOO LOUD once the level reaches it. Press Reset min/avg/max to start a fresh session without releasing the microphone, or ■ Stop meter to finish.
Because the scale is relative rather than calibrated, a threshold copied from someone else’s setup is close to meaningless. Ten minutes of watching your own room on your own laptop is what makes the warning trustworthy.
Reading min, avg and max across a lesson
The three figures under the bar track the lowest, highest and running mean level since the session started. They tell a story the live number cannot. A low average with three sharp spikes describes a class that was quiet apart from three moments; the same average with the minimum sitting close to it describes a room that hummed steadily all period. Glancing at the maximum afterwards is often more useful than watching the meter at the time.
Reset clears all three and leaves the microphone open, so you can run one reading per activity without granting permission again. Starting the meter from scratch also clears them. Stopping does not, which is deliberate: the numbers from the session you just finished are still there to read.
Two laptops in one room will not agree
Point two different machines at the same sound and you will very likely see two different numbers. Microphone sensitivity varies enormously between a laptop’s built-in array, a headset boom and a USB condenser, and how far the microphone sits from the sound shifts the figure as well. None of that is a bug, it is the direct consequence of having no calibration step. Compare readings from the same device in the same position, and they are meaningful. Compare across devices and they are not.
If what you actually want is which frequencies are present rather than how loud things are overall, the Audio Spectrum Analyzer taps the same microphone and draws the spectrum as animated bars. For the opposite direction, playing sound rather than listening to it, the Hearing Frequency Test and the Speaker Test both generate tones through an oscillator instead of opening the microphone at all.
Turning the browser’s own audio clean-up off
Browsers assume a microphone request is for a voice call, and voice calls want echo cancellation, noise suppression and automatic gain control. All three are actively harmful to a loudness meter, and gain control most of all: its entire job is to make quiet input louder and loud input quieter, which is precisely the difference this page exists to show. So the microphone request here asks for all three to be switched off.
That is a request, not a guarantee, and some browsers ignore parts of it. It is one more reason the readings are relative. Not every microphone tool needs the same treatment, which is why the spectrum analyzer here opens the microphone with default constraints instead, and why the Online Guitar Tuner cares about pitch rather than level. The rest of the hardware testers sit on the same hub.