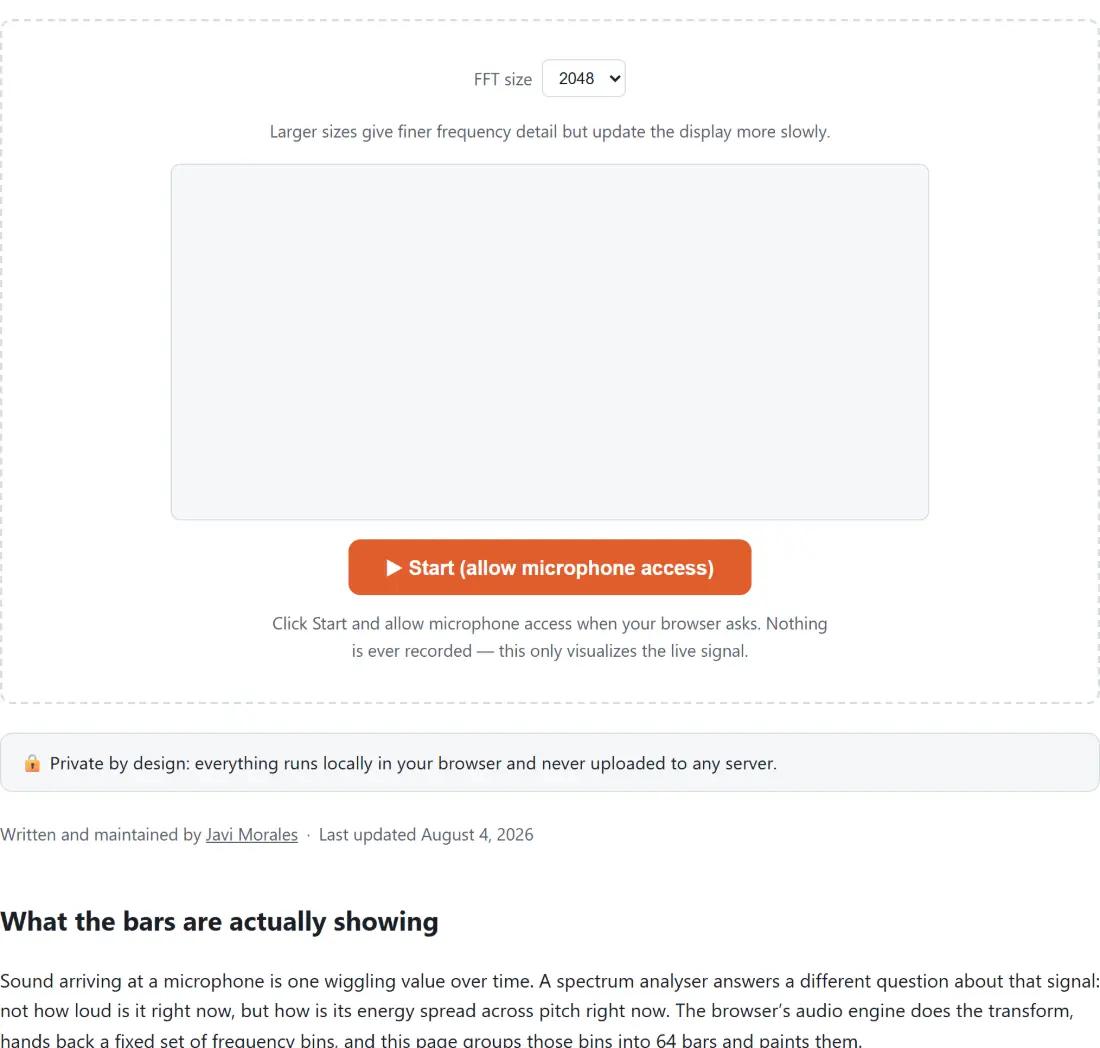
Watch your microphone's live frequency spectrum as 64 animated bars, with a selectable FFT size. Nothing is recorded, nothing is uploaded, no download.
Larger sizes give finer frequency detail but update the display more slowly.
Click Start and allow microphone access when your browser asks. Nothing is ever recorded — this only visualizes the live signal.
🔒 Private by design: everything runs locally in your browser and never uploaded to any server.
Written and maintained by Javi Morales·Last updated
What the bars are actually showing
Sound arriving at a microphone is one wiggling value over time. A spectrum analyser answers a different question about that signal: not how loud is it right now, but how is its energy spread across pitch right now. The browser’s audio engine does the transform, hands back a fixed set of frequency bins, and this page groups those bins into 64 bars and paints them.
That is the whole loop, repeated on every animation frame. Speak and you will see a hump in the low and low-mid bars where the fundamental of a human voice sits, with a scatter of smaller bars above it for the harmonics that make one voice sound different from another. Whistle and you get a single narrow spike that slides sideways with the pitch. Clap and everything lights up at once for a fraction of a second, because a transient contains energy at every frequency.
Getting a reading
Choose an FFT size from the selector. Leave it at 2048 unless you have a reason not to.
Click Start and allow the microphone permission when the browser asks.
Make a sound and watch the bars. The selector locks while it runs.
Click Stop to release the microphone. To change FFT size, stop first, change it, then start again.
There is no result to download and no session to save, which is why the tool has no output area at all.
FFT size is a trade, not a quality setting
It is tempting to read the four numbers as low to high quality and jump straight to 4096. They are not that. A larger FFT means the analysis looks at a longer stretch of audio, so it can tell two nearby frequencies apart more precisely, but it also means each frame you see is an average over more time and reacts more slowly to a change.
At 4096 on a 48 kHz device each bin covers about 11.7 Hz, which is precise enough to separate two close musical notes. At 512 each bin covers 93.75 Hz, coarse in pitch but noticeably snappier when you are watching rhythm rather than pitch. If you are looking at a steady tone, go large. If you are looking at speech or a beat, go small. That is the actual decision.
The frequency axis is linear, and that is a real limitation
The 64 bars divide the available bins evenly, so every bar covers the same width in hertz. Human pitch perception is not like that at all. The octave from 100 Hz to 200 Hz feels exactly as wide as the octave from 5 kHz to 10 kHz, but on a linear axis the first occupies a fraction of one bar and the second occupies more than a dozen.
The visible consequence is that all the interesting detail in speech and music is crammed into the left edge while the right half of the display shows a stretch of spectrum that is mostly empty most of the time. A logarithmic remapping would fix that, and it is not implemented. If you want to inspect a specific frequency precisely rather than survey the whole range, generate it deliberately with Tone Generator and watch which bar moves.
Where a spectrum fits among the other checks
A spectrum tells you what is in the signal, not whether the hardware is wired correctly. For the latter, Speaker Test drives each channel independently and Webcam and Microphone Test confirms the capture device is the one you think it is before a call.
If you want to keep the audio rather than just look at it, Voice Recorder captures the microphone to an MP3 or WAV file. For a loudness reading in place of a frequency breakdown, Noise Meter measures level over time. Everything else lives on the audio hub.
See it in action
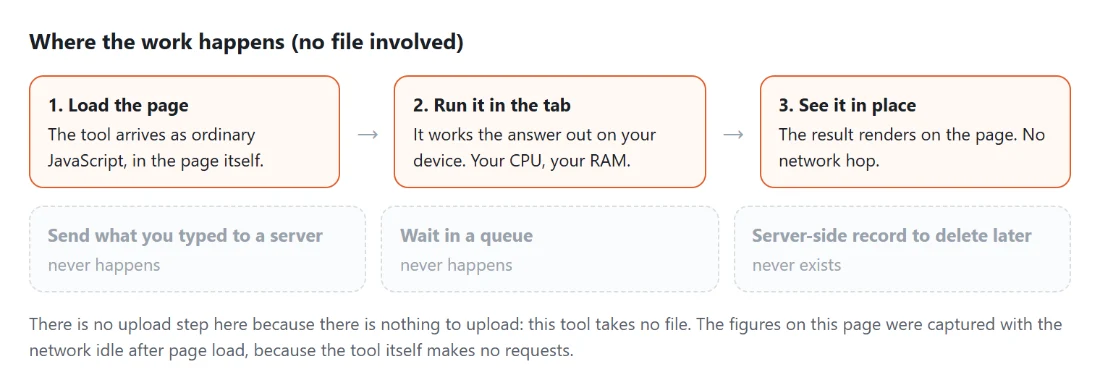
Audio Spectrum Analyzer mid-process: an audio spectrum analyser with FFT sizes of 512 through 4096 and the trade-off stated plainly - larger sizes give finer frequency detail but update the display more slowly - above a start button that asks for microphone access.Where the work happens on a SysFenix page that has no file input at all: the tool arrives as ordinary JavaScript inside the page, works the answer out on your own device and renders it in place, so the upload, queue and server-side record a typical online tool needs never happen.
Frequently asked questions
Is anything recorded or saved while the analyser runs?
No, and there is nothing to save. The analyser taps the live microphone signal, reads a snapshot of its frequency content each animation frame, paints that snapshot and discards it. No buffer of past audio is kept, there is no download button because there is no file, and stopping releases the microphone stream. That is also why the page cannot show you the spectrum of something that already happened.
Why can I not hear my own microphone through the speakers?
Because the analyser is deliberately not wired to the audio output. It taps the signal only to measure it. Connecting it to the speakers as well would put your microphone and your speakers in the same room on the same signal path, which is the textbook recipe for howling feedback. Keeping the graph silent is the correct behaviour, not a missing feature.
What does changing the FFT size actually do?
It sets the window size the analysis works over. The four choices are 512, 1024, 2048 and 4096, with 2048 as the default. The number of frequency bins is always exactly half the FFT size, so 2048 gives 1024 bins and 4096 gives 2048. More bins means finer frequency resolution but a longer window of audio behind each frame, so the display responds more sluggishly to a fast change. The selector is locked while the analyser is running, so pick a size before you press start.
How wide is each bar in frequency terms?
It depends on the FFT size and your device's sample rate, and the tool always groups the bins into exactly 64 bars. On a 48 kHz device at the default 2048, each bin covers 23.4375 Hz and each bar averages 16 of them, so one bar spans roughly 375 Hz. Drop to an FFT size of 512 and each bin covers 93.75 Hz instead, with four bins per bar. The bars always span from 0 Hz up to half the sample rate, which is 24 kHz on that same device.
Why do the low bars look so crowded compared with a music app?
Because the frequency axis here is linear, not logarithmic. Every bar covers the same number of hertz, which means the entire bass range that we perceive as a wide musical span is squeezed into the first few bars while the top half of the display covers frequencies most people cannot hear at all. Music visualizers usually remap the axis logarithmically to match pitch perception. That remapping is not implemented here, and saying so is more useful than pretending the display is something it is not.
What does the height of a bar mean?
The browser's own analyser returns each bin as a value from 0 to 255, already scaled logarithmically in decibels internally, and the bar height is a straight linear mapping of that value onto the canvas height. A full height bar is 255. Each bar shows the average of its bins rather than the loudest one, which makes the display smoother and less prone to a single spiky bin dominating a whole bar.
It says it cannot access my microphone. What now?
That message appears when the browser's microphone permission request is refused or unavailable. Check the permission prompt, and if you previously blocked the site, clear that decision from the padlock or site settings menu in the address bar. Also check that your operating system has not blocked microphone access for the browser as a whole, which is a separate switch on both macOS and Windows.
Can I analyse a file instead of the microphone?
Not here. The input is the live microphone stream only, so there is no way to point it at an existing recording. For information about a file, other tools on the site read the file itself rather than listening to it.
Four speaker checks in your browser, a hard left/right channel test, a stereo pan sweep, six frequency tones and a 50 Hz bass test. Nothing is recorded.