Reaction Time Test

Click when the box turns green, five times, and get your average, best, worst, a rating and an estimated percentile. Results stay in your browser.

🌐 Español

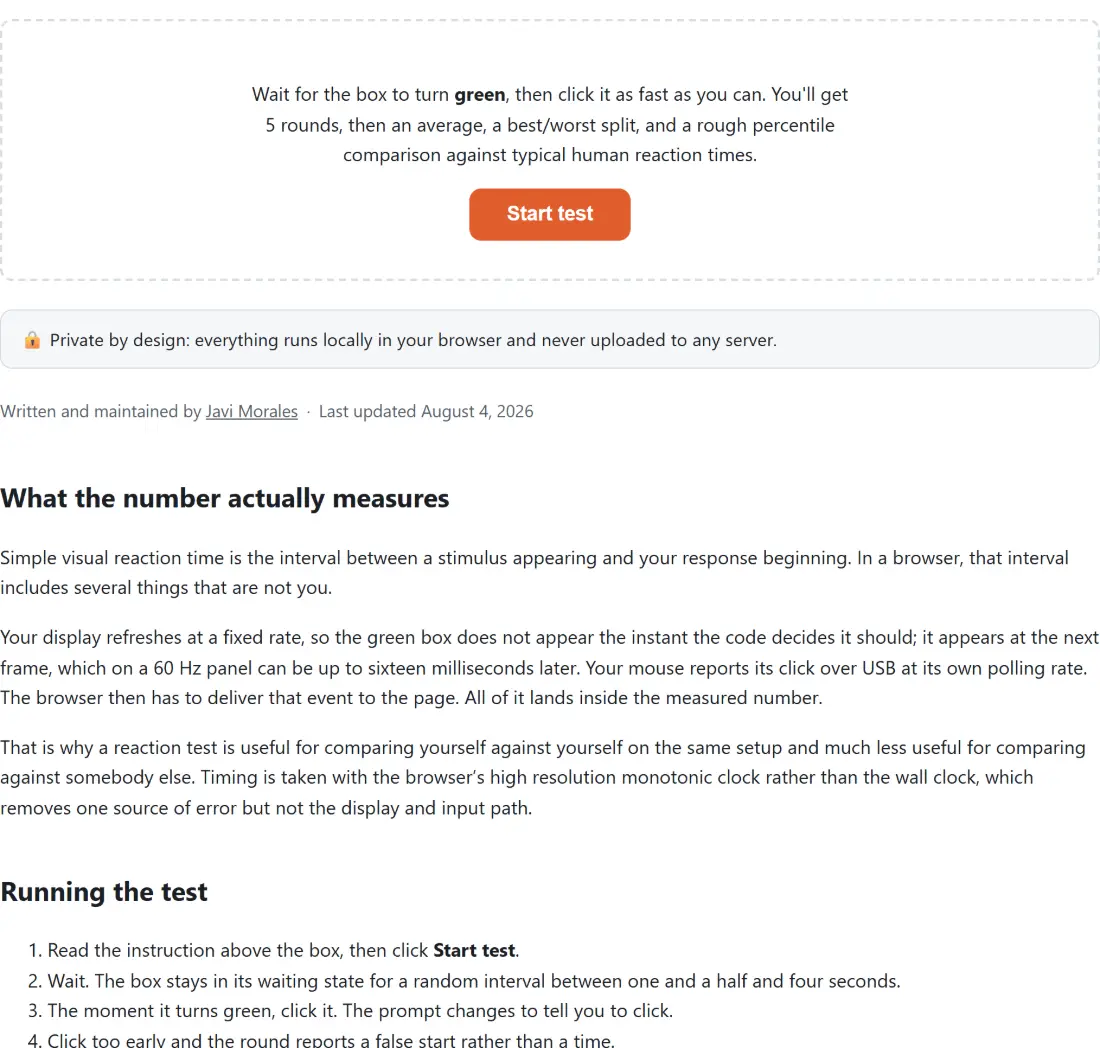
Wait for the box to turn green, then click it as fast as you can. You'll get 5 rounds, then an average, a best/worst split, and a rough percentile comparison against typical human reaction times.

🔒 Private by design: everything runs locally in your browser and never uploaded to any server.

What the number actually measures

Simple visual reaction time is the interval between a stimulus appearing and your response beginning. In a browser, that interval includes several things that are not you.

Your display refreshes at a fixed rate, so the green box does not appear the instant the code decides it should; it appears at the next frame, which on a 60 Hz panel can be up to sixteen milliseconds later. Your mouse reports its click over USB at its own polling rate. The browser then has to deliver that event to the page. All of it lands inside the measured number.

That is why a reaction test is useful for comparing yourself against yourself on the same setup and much less useful for comparing against somebody else. Timing is taken with the browser’s high resolution monotonic clock rather than the wall clock, which removes one source of error but not the display and input path.

Running the test

  1. Read the instruction above the box, then click Start test.
  2. Wait. The box stays in its waiting state for a random interval between one and a half and four seconds.
  3. The moment it turns green, click it. The prompt changes to tell you to click.
  4. Click too early and the round reports a false start rather than a time.
  5. Repeat until five rounds are done.
  6. Read Your results, which gives your average, best, worst and a rating.
  7. Try again starts a fresh test. Clear history empties the table of recent results.

Use a mouse rather than a trackpad if you have the choice, and expect your first round to be your worst. Warming up with one discarded test is normal.

The anti-cheat is a state check, not a timing check

The obvious way to game a reaction test is to click continuously and let one of the clicks happen to land just after the signal.

Guarding against that by looking at the timestamp is the wrong approach, because a click that arrives just after the transition genuinely has a small elapsed time. The check here is on the phase instead: a click only counts as a reaction when the box is already in its ready state and a real signal timestamp was recorded. A click during the waiting phase is a false start regardless of any timestamp, and so is a ready state with no recorded signal.

False starts are counted and shown in the summary rather than being quietly dropped. A run with three of them is visibly a run with three of them, which is the honest presentation.

There is a second, softer check. A valid round under a hundred milliseconds is flagged as suspiciously fast rather than rejected, because human visual reaction has a floor well above that and a sub-hundred result is much more likely to be a coincidence than a reflex.

None of this survives someone editing the page’s own code, and the page says so. A test with no server cannot promise more than that.

Reading the percentile

The percentile is modelled, not measured. Adult simple visual reaction time is treated as a normal distribution with a mean of 273 milliseconds and a standard deviation of 45, both commonly cited approximate figures, and your average is placed on that curve.

So an average of 273 comes out at the fiftieth percentile and rates as average. Around 250 lands near the seventieth and rates above average. Getting under 200 rates exceptional, and 300 rates below average because it sits over half a standard deviation on the slow side.

The result is clamped between 1 and 99. A model this rough should never claim you are faster than everyone or slower than everyone, and the clamp is the honest expression of that.

The underlying normal distribution function is the standard textbook rational approximation, which is accurate to about seven decimal places and independently checkable rather than invented here.

For a sustained input rate rather than a single response, CPS Test measures mouse clicks and Spacebar Counter measures key presses.

Aim Trainer combines reaction with pointing accuracy, which is the more game-relevant skill. Mouse Tester and Keyboard Tester check that the hardware itself is behaving, which is worth doing first if your times suddenly get worse. And since your display’s refresh rate is part of the measurement, Refresh Rate Test tells you what it actually is. The rest is on the testers hub.
See it in action

Screenshot of the Reaction Time Test tool with a reaction test explaining the protocol before it starts - wait for the box to turn green then click as fast as you can, over five rounds, reported as an average with a best/worst split
Reaction Time Test mid-process: a reaction test explaining the protocol before it starts - wait for the box to turn green then click as fast as you can, over five rounds, reported as an average with a best/worst split.
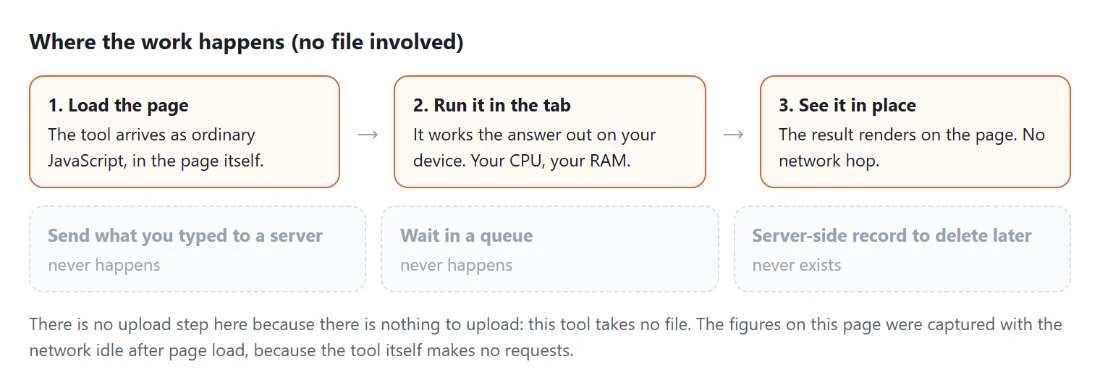
Diagram: where the work happens on a SysFenix page that has no file input at all: the tool arrives as ordinary JavaScript inside the page, works the answer out on your own device and renders it in place, so the upload, queue and server-side record a typical online tool needs never happen
Where the work happens on a SysFenix page that has no file input at all: the tool arrives as ordinary JavaScript inside the page, works the answer out on your own device and renders it in place, so the upload, queue and server-side record a typical online tool needs never happen.

Frequently asked questions

How many rounds does the test run?

Five. That is enough for a stable average without the boredom that sets in around ten, and it means one unlucky round does not dominate the result. The summary reports the average, the best and the worst, so you can see how much variation there was rather than just the mean.

How long is the wait before the green signal?

A random interval between one and a half and four seconds, redrawn every round. The randomness is the point. A fixed delay would let you learn the rhythm and start moving before the signal appears, which measures anticipation rather than reaction.

What counts as a false start?

Any click made while the box is still in its waiting state. The check is on the phase rather than on the timestamp, so clicking early can never be turned into a suspiciously fast reaction time by chance. False starts are counted and reported in the summary rather than silently ignored, so a run with several of them is visibly a run with several of them.

Can I cheat this?

Not by clicking early, which is the strategy the phase check exists to defeat. Anyone determined enough could edit the running JavaScript, and no test that runs entirely in your browser with no server can prevent that. What the check does stop is the ordinary approach of hammering the mouse and hoping to land on the transition.

What does the suspiciously fast flag mean?

That a valid round came in under a hundred milliseconds. Human visual reaction has a physiological floor commonly cited around 150 to 200 milliseconds, so anything under a hundred almost certainly means the click coincided with the signal rather than responding to it. The round still counts; it is flagged rather than rejected.

How is the percentile worked out?

From a normal distribution model of adult simple visual reaction time, using a commonly cited mean of 273 milliseconds and a standard deviation of 45. Your average is converted to a position on that curve. It is a rough statistical estimate rather than a comparison against real users of this page, and it is clamped between 1 and 99 so it never claims to have beaten everybody.

Why does 300 milliseconds rate as below average?

Because the reference mean is 273, so 300 sits a little over half a standard deviation on the slow side. Around 250 rates above average, 273 itself rates average, and getting under 200 rates exceptional. The rating and the percentile use the same underlying calculation, so they always agree with each other.

Where are my past results stored?

In this browser's local storage on this device, capped at the last twenty tests, with a clear button next to the history table. Nothing is uploaded and there is no leaderboard. Your device, its input lag and your display's refresh rate all affect the number, so comparing across machines is not meaningful.

Related tools